Position Statecharts
— Version 1.0.0
Abstract
The power and responsibility one has in a situation is formalised by one's position within it; positions and the ways of entering/exiting them — position systems — are thus a foundational governance concern. Constitutional ambiguities may remain hidden and newcomer empowerment may be obstructed if a position system is not clearly understood. This article aims to make such information more easily understandable through visualisation with appropriate diagrams. To establish a grounded understanding of position systems and their context within governance, the Institutional Analysis and Development framework is examined. The state machine model, which represents system behaviour as states and transitions, is then considered as a fit for position systems. The argument is made that position system can be modelled as state machines, with positions and their entry/exit events being mappable onto states and transitions respectively. The extension of state diagrams to statecharts are well-suited to visualize position systems. The planning and production of such a position statechart for a real-life case using pen & paper and free and open-source software is demonstrated.
Introduction
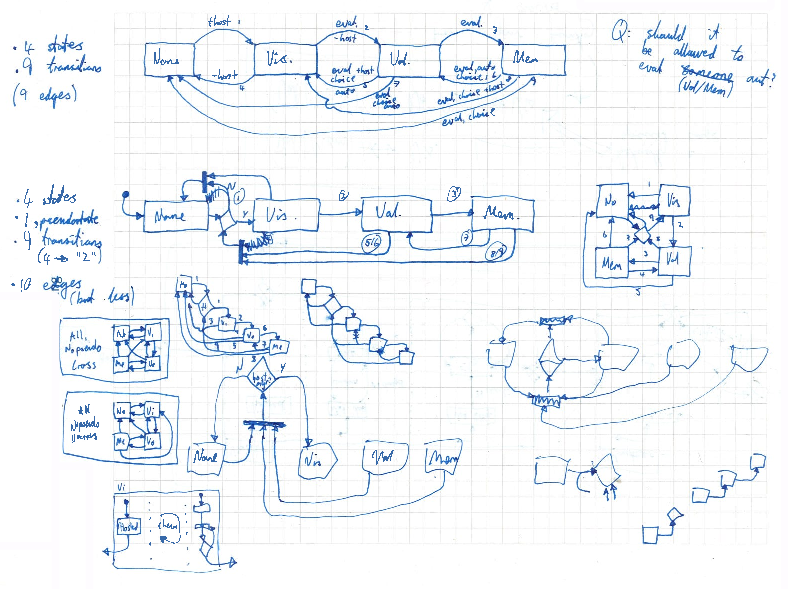
In 2025 I initiated a change to the Kanthaus constitution. (Kanthaus is a "project house" I co-founded in 2017.) The system of positions had some long-standing issues I wanted to fix. During the discussion to find a solution, David posted a "state/flow chart" he had sketched to clarify the status quo (Figure 2.)
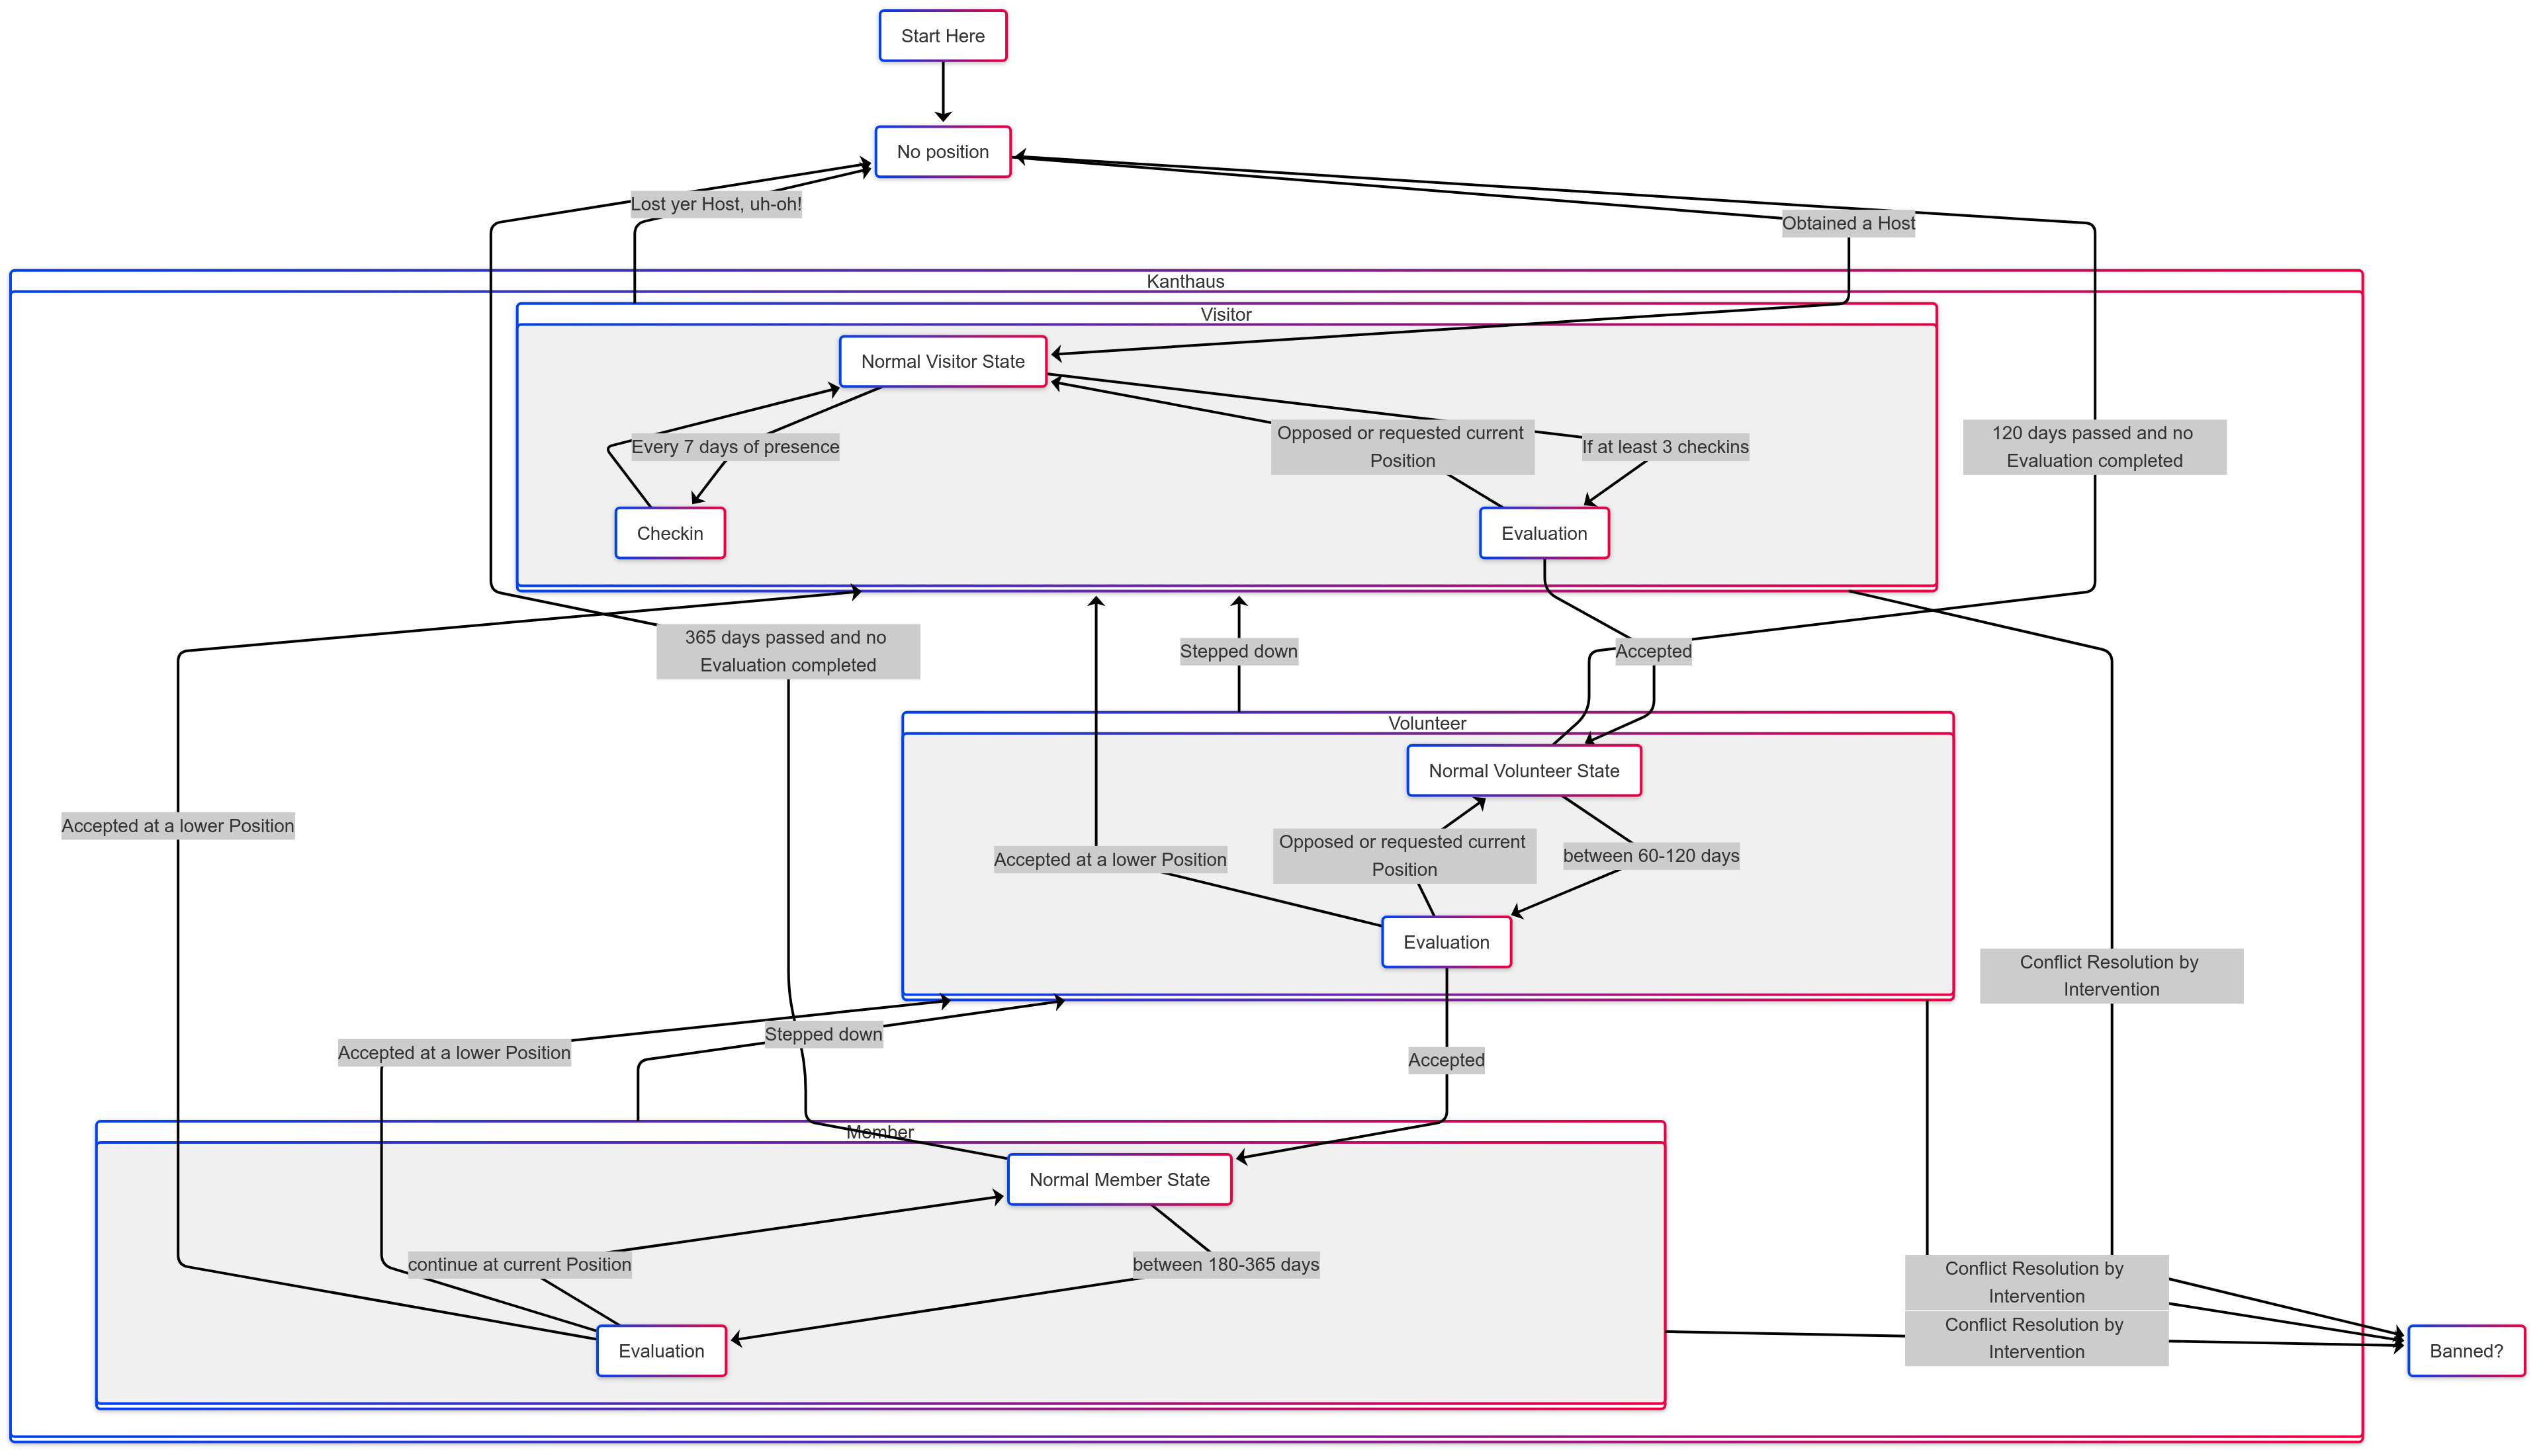
I had made vague sketches in that direction in the past, but nothing so comprehensive. Although graphically a bit confusing, the chart helped make the somewhat challenging text of the constitution easier to understand, and highlighted some ambiguities: could a person become a Visitor through an evaluation at a higher position without a host? Without conclusively resolving every issue, we came to a good-enough consensus and changed the constitution. David's diagram sank into memory.
Then in early summer 2026 I went to friend's doctoral defence. As the debate over the philosophy and history of ideas washed over me, I leafed through a hard-copy of the thesis. The utility of diagrams sprang back to my attention when I read, and re-read:
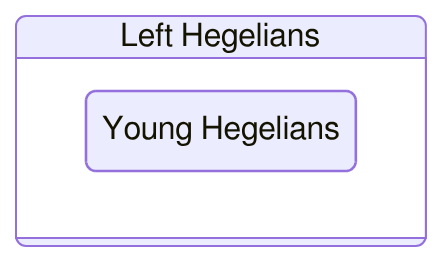
It is important to note that all Young Hegelians were Left Hegelians, however, not all Left Hegelians were Young Hegelians.
While I understand such claims as text, it takes noticeable effort. In comparison, an equivalent diagram, in this case an Euler diagram, feels almost effortless (Figure 3.)
And with that prompt, David's chart and the difficulty of comprehending the constitution came back to haunt me.1
An argument for clear and transparent governance is made on egalitarian grounds by Jo Freeman in The Tyranny of Structurelessness (1972). In her reflection on the US feminist movement, Freeman describes their rejection of formal governance ("structure") in reaction to the over-structured society women found themselves dispossessed by. While this approach did have some liberatory effects, the outright refusal to make de facto power structures transparent ultimately contributed to the formation of elites. The argument would be made on economic and ecological grounds with empirical justification some time later by Elinor Ostrom in Governing the Commons (1990), which we'll come back to shortly.
History and theory aside, anyone who's done any amount of organising will simply know how critical it is that everyone knows the rules, structures, governance. While text will likely remain the primary medium, could accessibility and comprehension be improved through visualisations? I say yes.
1 Position systems
I use the term position system to refer to the set of roles available in some context and the procedures for entering and exiting them. This section grounds that hopefully intuitive concept in some of the deep research done on that topic.
1.1 Ostrom and the IAD
Elinor Ostrom spent decades studying and meta-studying common-pool resources — extensive, natural resources like forests and fishing grounds — and the communities using them. She conclusively demonstrated that people can and do successfully self-organise to share such resources sustainably without state management or privatisation. While I hope you don't find this conclusion so surprising, in the economic debate of the 1970's the opposite idea was ascendant, feeding political narratives to justify distrust in communities and dispossession of indigenous people — and that idea is still alive.2 Ostrom brought her work together in the book Governing the Commons (1990). She (co-)won the the Nobel Memorial Prize for Economics in 2009 for this work, the first woman to do so.3
While economics has come to focus on money and markets, Ostrom focused on institutions, which she broadly described as "the prescriptions that humans use to organise all forms of repetitive and structured interactions".4 This broad understanding includes family structures, government committees and everything in between. It is with this lens of institutionalism she approached all her work, which was not limited to the commons. In her less famous but equally important book, Understanding Institutional Diversity (UID) (2005), Ostrom presented the Institutional Analysis and Development (IAD) framework, synthesised out of years of work to try and identify "universal building blocks"5 for the incredibly varied institutional situations we find in our world.
1.2 Action situations: Participants and Positions
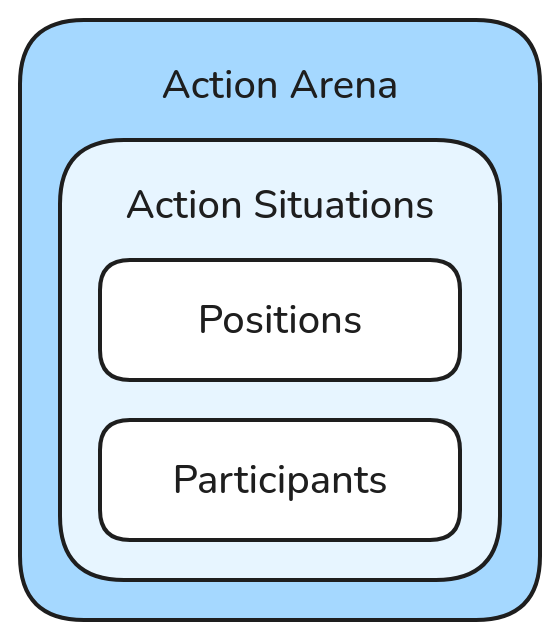
The IAD framework focuses on Action Arenas and the many Action Situations that occur within them. An Action Arena is some kind of space in which repeated institutional activity occurs. An Action Situation is a discrete interaction event between participants, some slice of day-to-day activity. To give some examples:
| An Action Arena | An Action Situation in that arena |
|---|---|
| A school | The headteacher changes the dress code, making ties now optional. |
| A chatroom | After warning them twice about spamming, a moderator bans a user. |
| A co-housing syndicate | At an assembly, members accept the entry of a new group. |
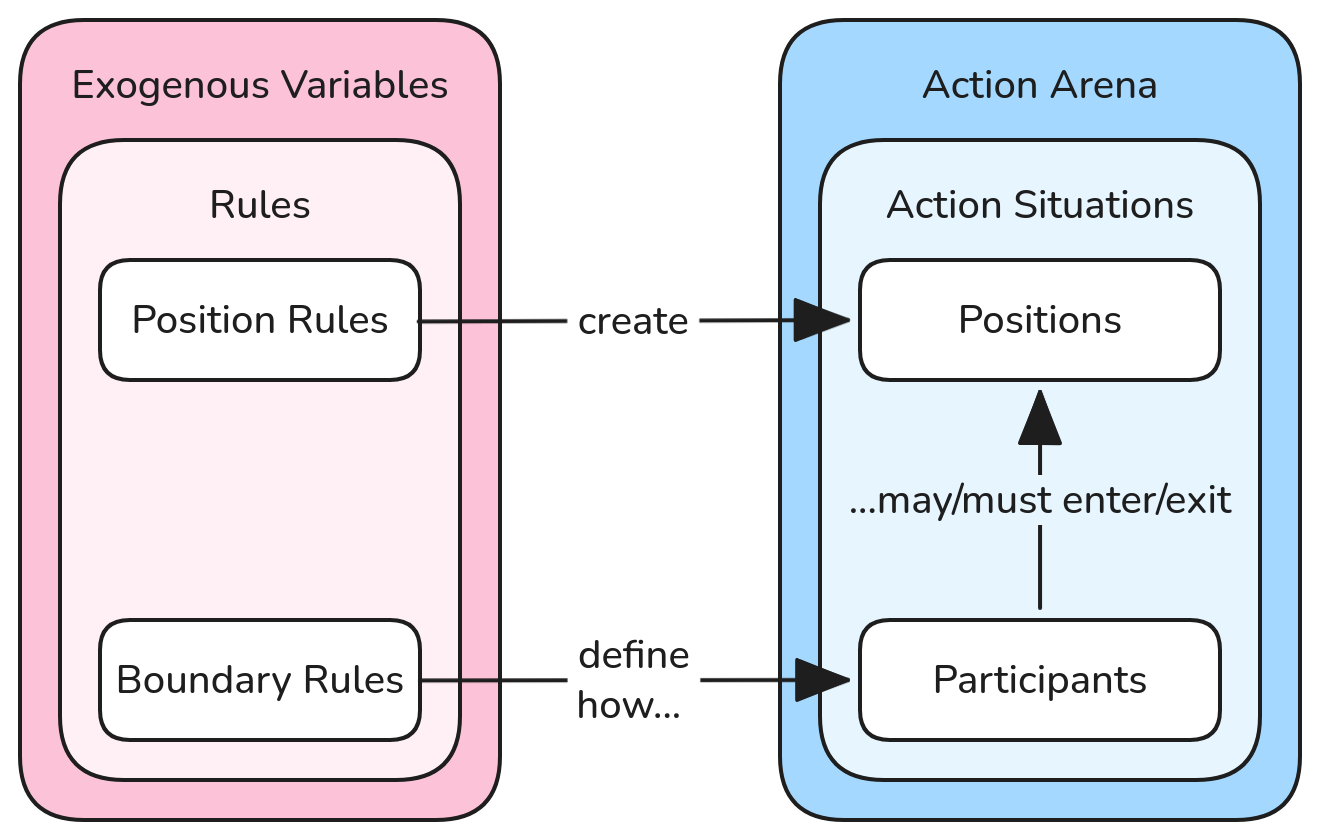
The IAD identifies seven "clusters of variables" in Action Situations, which aim to cover all institutionally relevant elements of such interactions, named: Participants, Positions, Actions6, Information, Control, Net Costs and Benefits, and Potential Outcomes. The first two describe what I mean by position systems, with Positions referring to the recognised roles participants could hold and Participants referring to the specific individuals who hold specific positions (Figure 4.)
1.3 Rules: Boundary and Position
But where did the positions come from? And how did the participants get to hold theirs? The IAD framework defines a region outside of the Action Arena it calls Exogenous Variables.7 This region contains three elements that systematically affect a given Action Arena, and all the Action Situations within it:
- the physical and biological conditions of the environment
- the culture of the community, and
- the rules in use
While all elements are significant, rules are most clearly in conscious control of the participants determine position systems. The IAD has seven rules categories, one corresponding to each of the Action Situation variables.
Position Rules correspond to the Position Action Situation variable. They create positions, which Ostrom refers to as "anonymous slots" or "holders" for participants to enter (and exit). Positions are collective fictions which act as bridges between individual people and acceptable actions, turning position holders into members of a political class. Position Rules are restricted to cover only the creation of positions, mostly just naming them, and are therefore "often not by themselves intrinsically interesting"!8
Boundary Rules correspond to the Participants Action Situation variable. They define who is eligible to hold a position, and how eligible people can enter and exit positions and/or the group. Eligibility often refers to attributes people can't voluntarily change, like age, or location and will not be of further interest here. Rules may be compulsory (such as a defendant in a court case) but are typically voluntary (the participant may chose to enter, if allowed, and exit freely). Rules defining entry may be invitational (if participants may only enter via an extension from existing members) or competitive (if new members are selected by some competition, like a vote).
1.4 Position systems — summary
Elinor Ostrom & co. developed the Institutional Analysis and Develeopment (IAD) framework to inspect diverse social interactions. It focuses on Action Situations, discrete events of participant interaction, which are situated within an Action Arena. Action Situations have seven internal clusters of variables. Rules, one of three Exogenous Variables, systematically affect the Action Situations, with one category of rules for each variable. Position Rules create positions and Boundary Rules define how participants can enter and exit those positions.
2 Statecharts
Now we turn to computers. I did not study computer science, and only heard about statecharts from a passing comment. But the more I looked into them and the state machines they depict, the more I became convinced they weren't too complicated — and a perfect match for position systems.
2.1 State machines: states and transitions
State machines are abstract models of system behaviour first introduced by Claude Shannon in A Mathematical Theory of Communication (1948). They are composed of only two elements:
- states - stable patterns of behaviour, and
- transitions - transient events that shift the system from one state to another
A state machine can be used to model a system at different levels. It forces modellers to explore the possible states of the system in question, and in doing so identify unintended or troublesome situations.
2.2 State diagrams — and explosions
State diagrams are graphs depicting state machines where states are displayed as nodes (i.e. boxes) and transitions as directed edges (i.e. arrows.) A state diagram for a light switch could be:
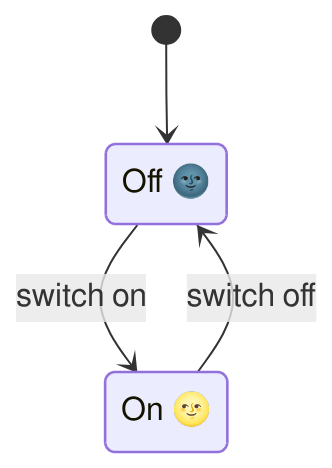
The black-filled circle in the above diagram represents an initial pseudostate, a symbol to indicate where the state machine starts.
OK, so no one really needed a diagram for a light switch. Here's a more complex state diagram for a fan which blows constantly when switched on, and can then be toggled to an "auto" mode:
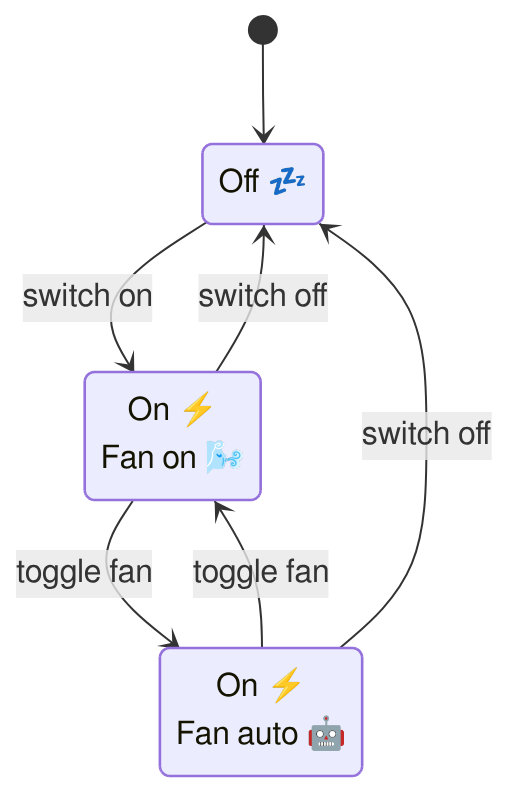
The issue with state diagrams like these is that they quickly get unreadable with more complex systems. To demonstrate this, let's extend the fan example to an air-conditioner which can heat or cool in either fan mode:
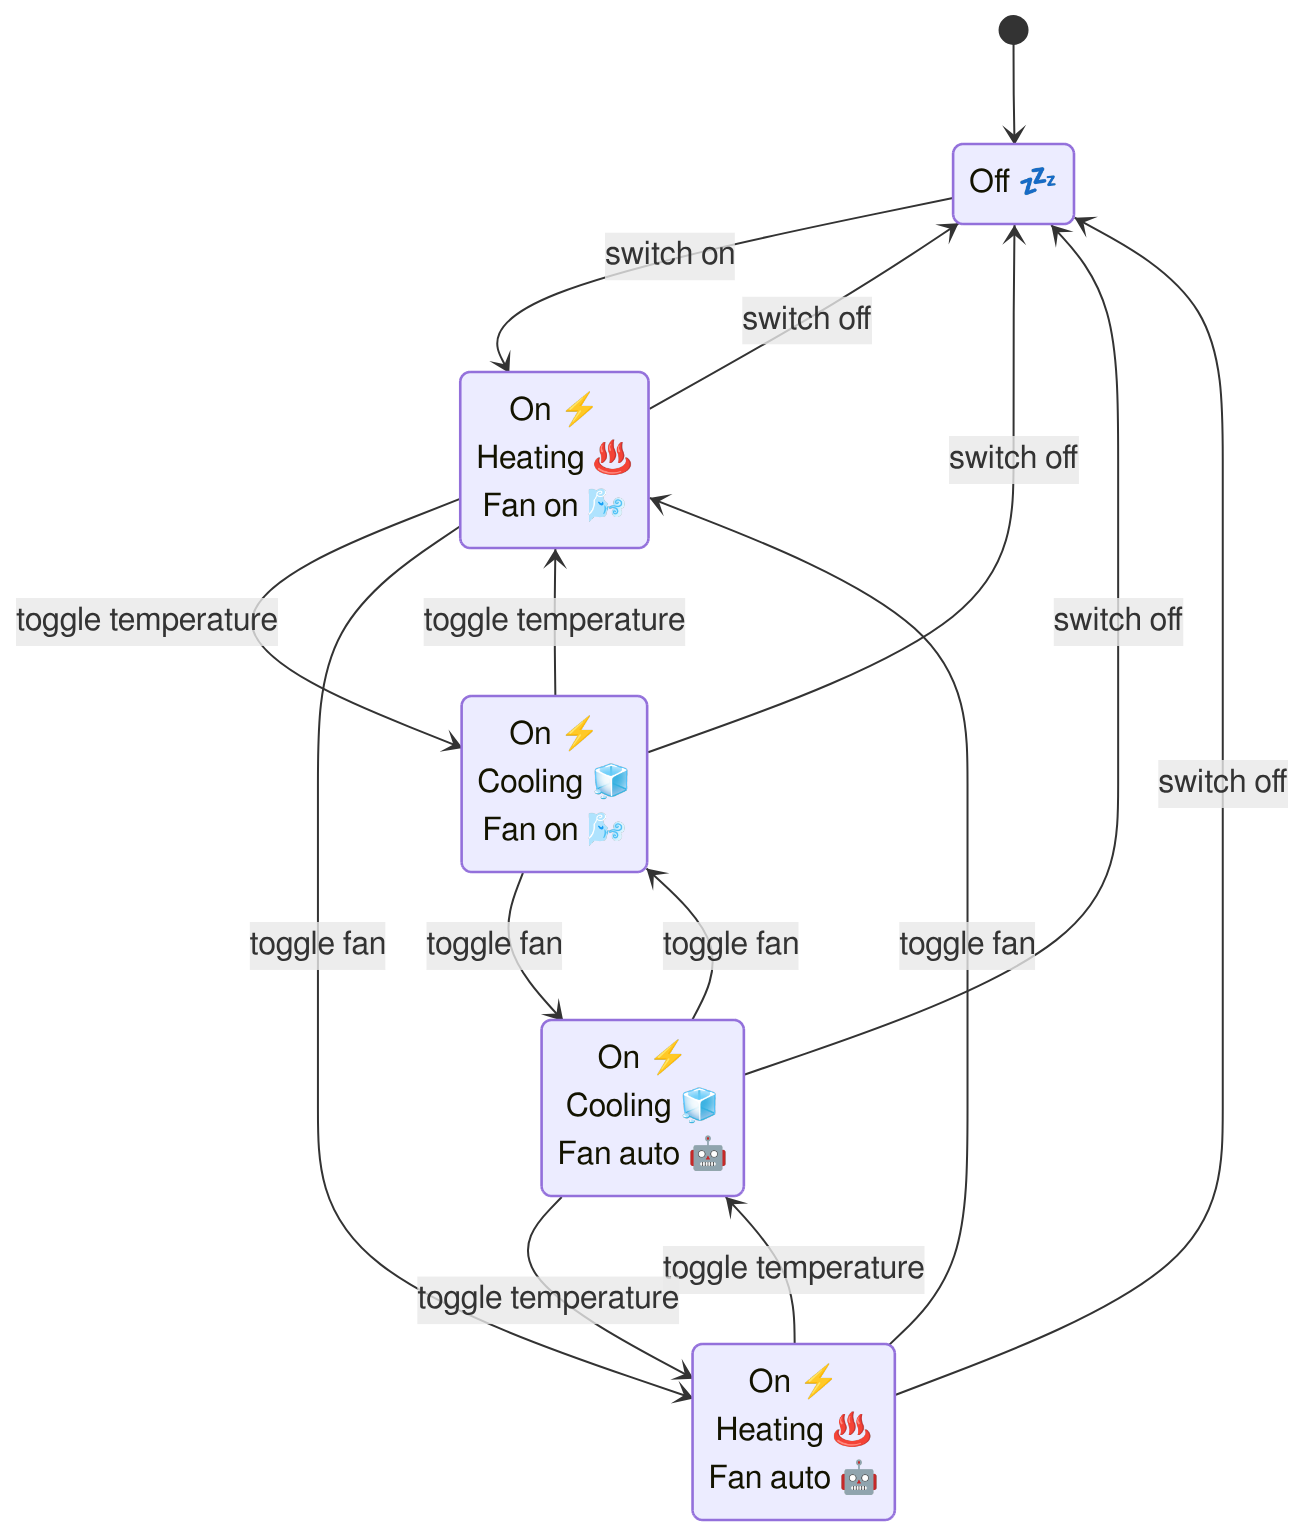
The addition of one extra mode doubled the number of active states. If "beep/silent" mode was further added, the number of active states would again double to 8, and so on. The phenomenon of up-to-exponential increase in states and transitions is known as state explosion.
2.3 Statecharts: hierarchy and concurrency
The issues with the initial state diagrams for anything more than simple systems became widely known. In 1987, David Harel published the paper Statecharts: A visual formalism for complex systems in which he elaborated on the issues of state diagrams arranged in a "‘flat’ unstratified fashion", then went on to present a set of extensions to "transform the language of state diagrams into a highly structured and economical description language" which he differentiated as statecharts.
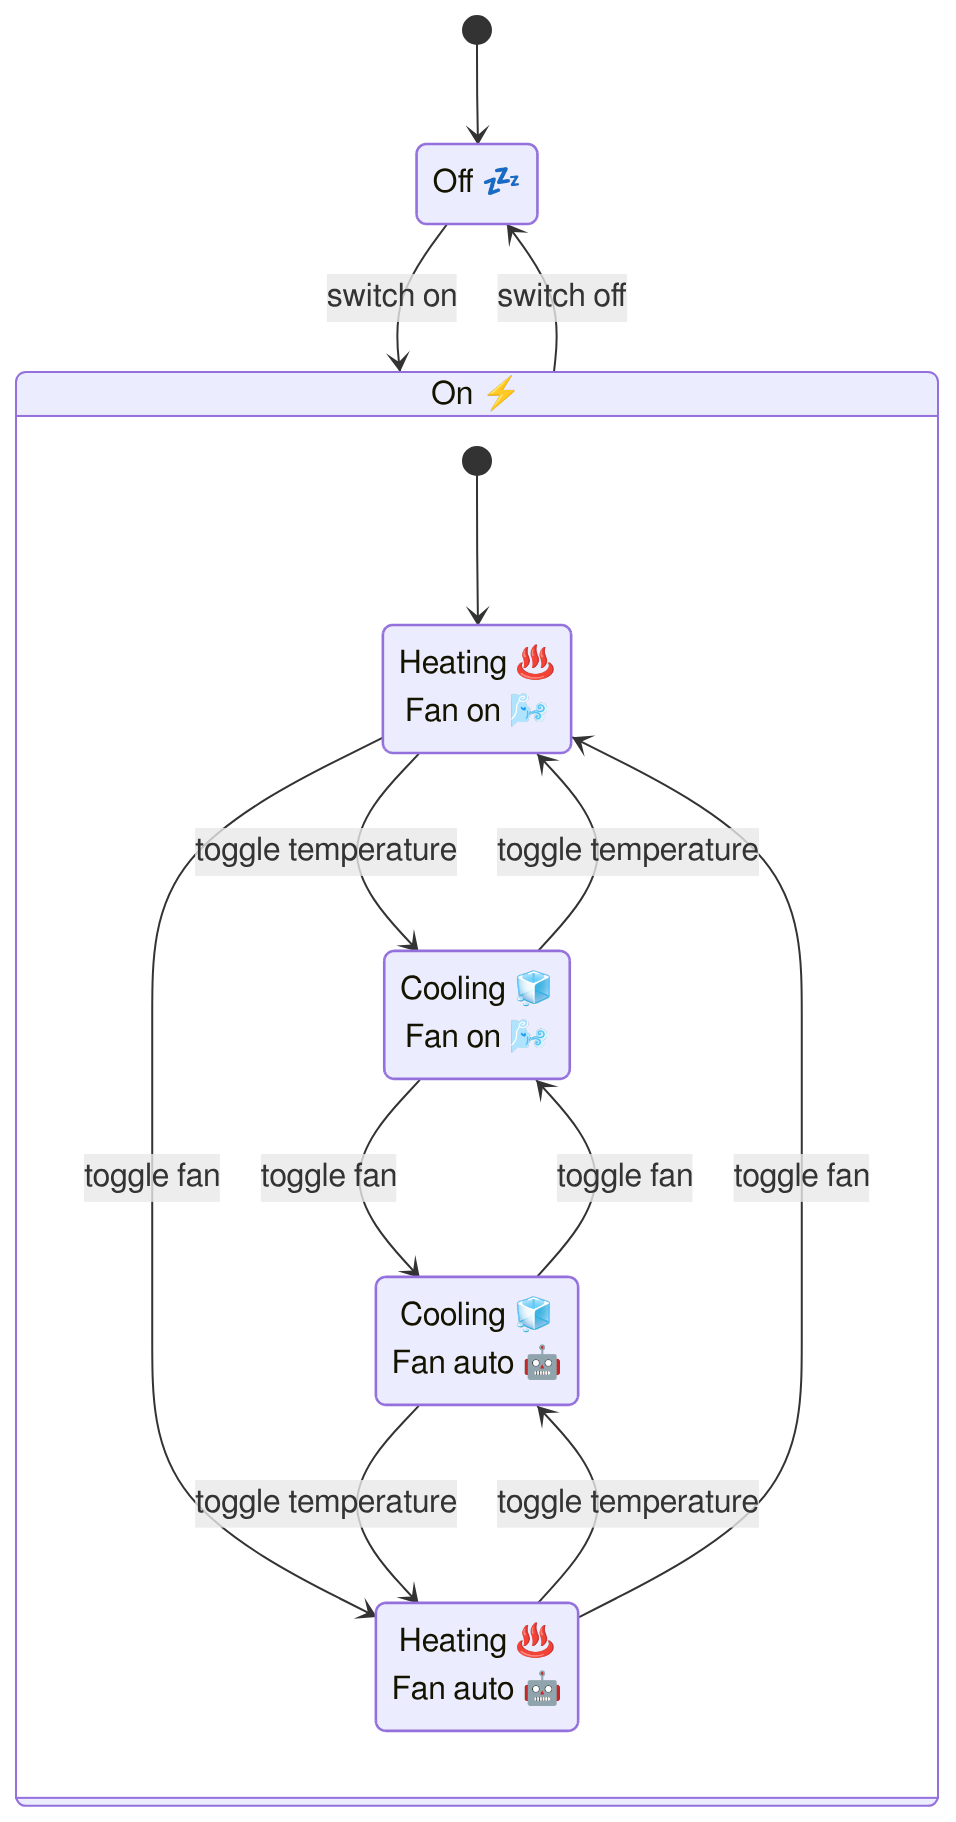
We'll look at those extensions by returning to the air-conditioner. The first major statechart element is hierarchy (a.k.a. depth or nesting.) This is hierarchy in a technical sense, not a social one, and describes the relations between states. If a state is only reachable through another state, it is a substate or child state of the first state (it's superstate or parent state). Substates are depicted as boxes within their respective superstate.
With the air-conditioner, all of the active states require the machine to first be switched "On", and from all active states can it be switched "Off". We can thus separate "On" as a parent state for all the active states, and nest them under it:
The second major element of statecharts is concurrency (a.k.a orthogonality or parallelism.) This refers to the ability for subsystems or sub-machines to run at the same time, in parallel. Concurrent subsystems are depicted as regions divided by a dashed line within their respective parent state. Important to note is that all subsystems start immediately when their respective superstate is entered.
Since "temperature" and "fan" modes of the air conditioner run simultaneously and can be toggled independently, they are more accurately modeled as 2 parallel subsystems within the "On" state:
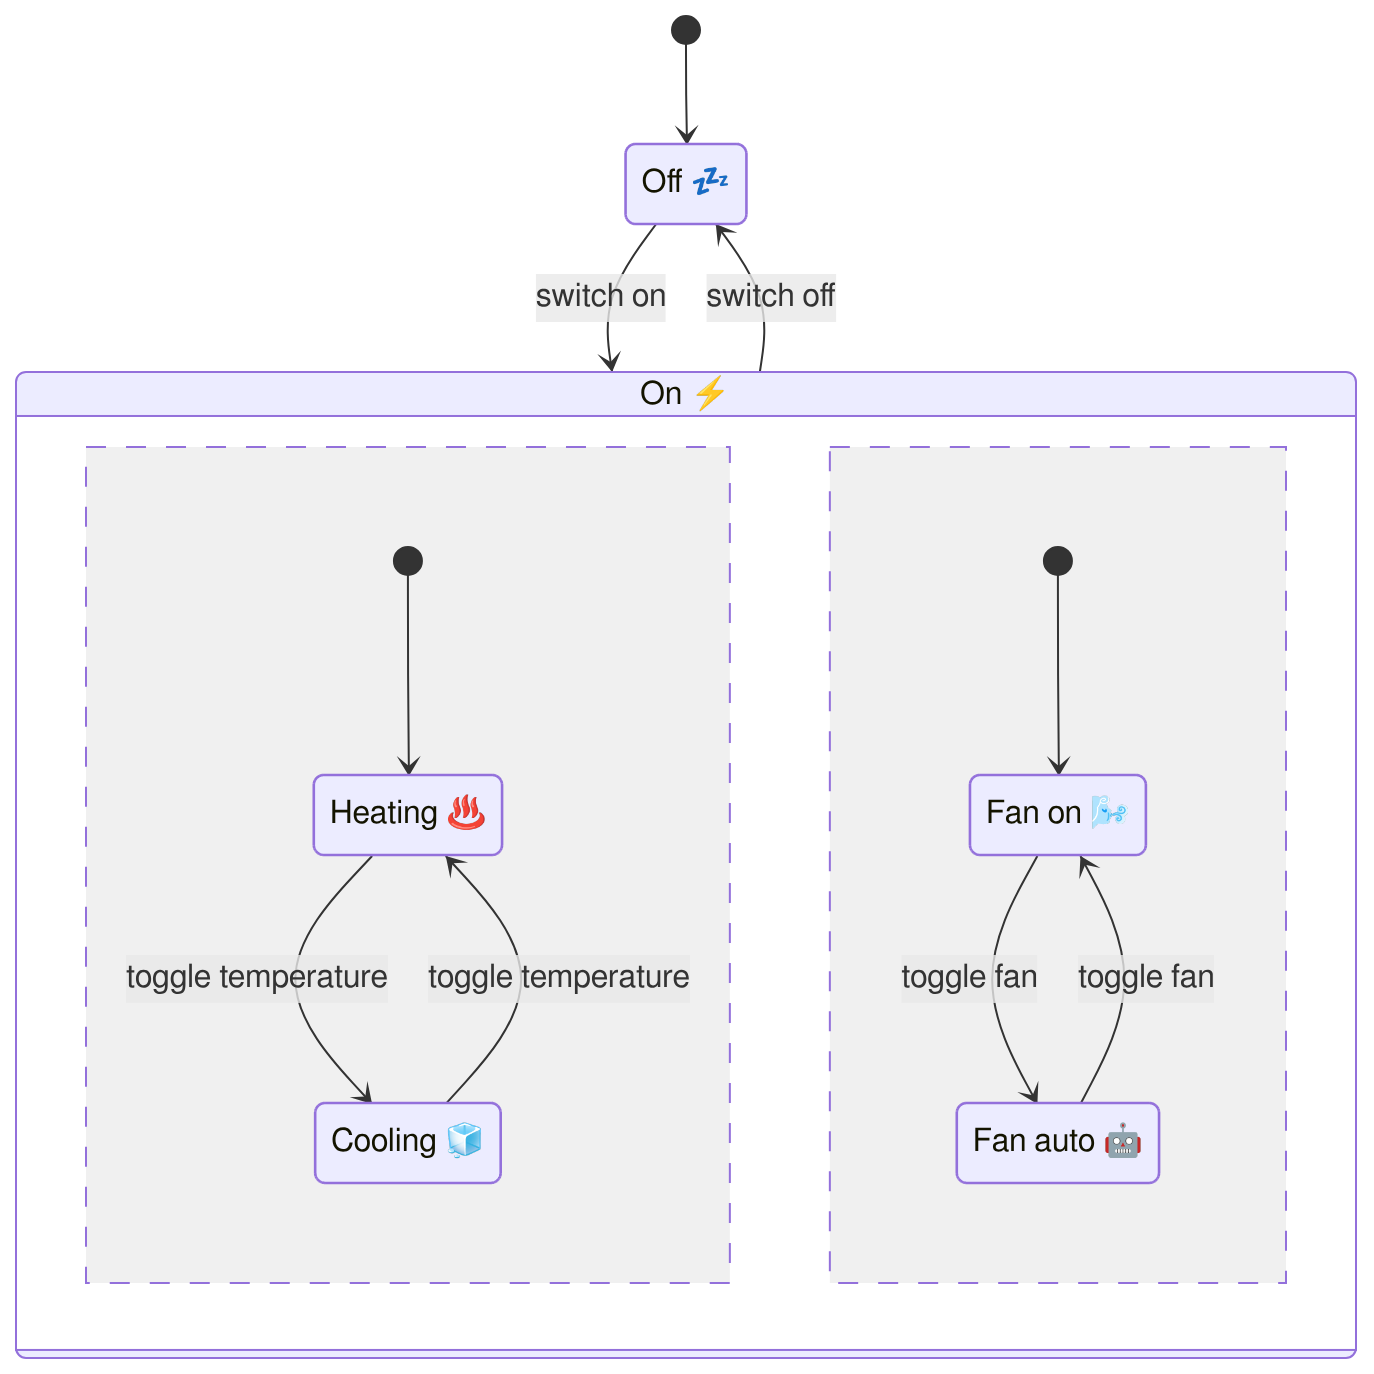
While the use of hierarchy and concurrency increase the number of boxes in this example, the number of arrows significantly decreases and the reduced visual complexity is self-evident.
2.4 UML: development and standardisation
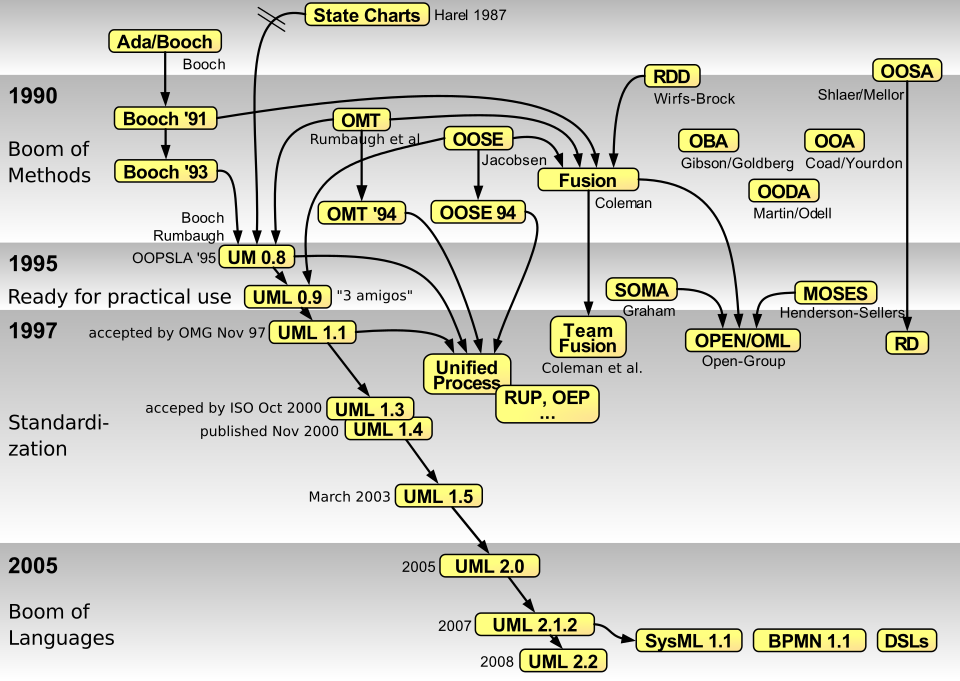
The extensions set out in Harel's paper were influential. The next years saw a boom in computational diagram methodologies including state diagrams, sequence diagrams, activity diagrams, class diagrams, etc. The diversity of diagrams created communication issues.
To try and standardise things, a consortium of major tech companies was founded in 1989 called the Object Management Group (yes, really: OMG.) In 1997 OMG adopted the then newly created Universal Modelling Language (UML) standard. UML aimed not only to bring standardisation to different technical diagram methods, but to also maximise the coherence between those diagram types. With the consortium's backing, UML was published as ISO/IEC 19501 in 2005. Although its popularity has waned, UML remains hegemonic in the diagramming world.9
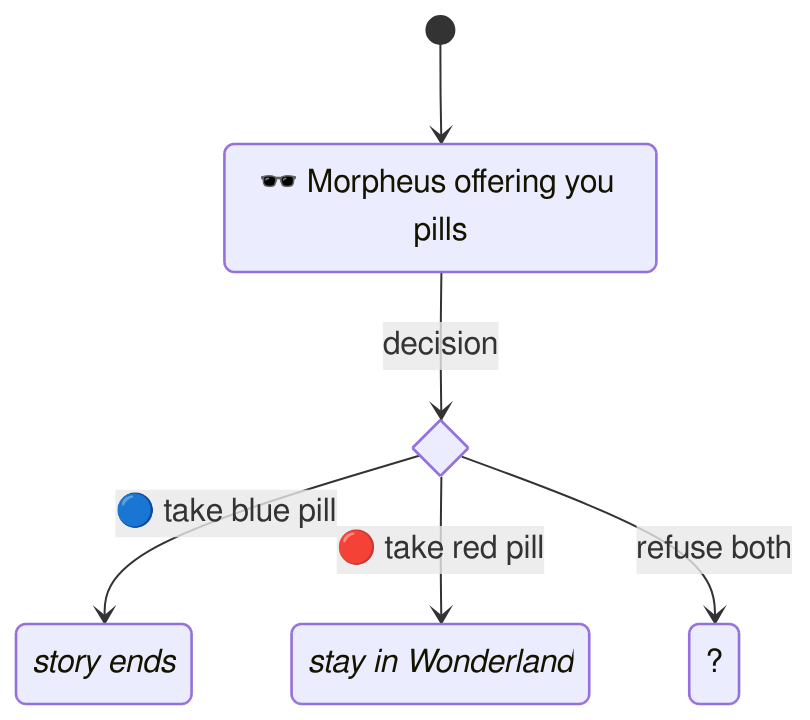
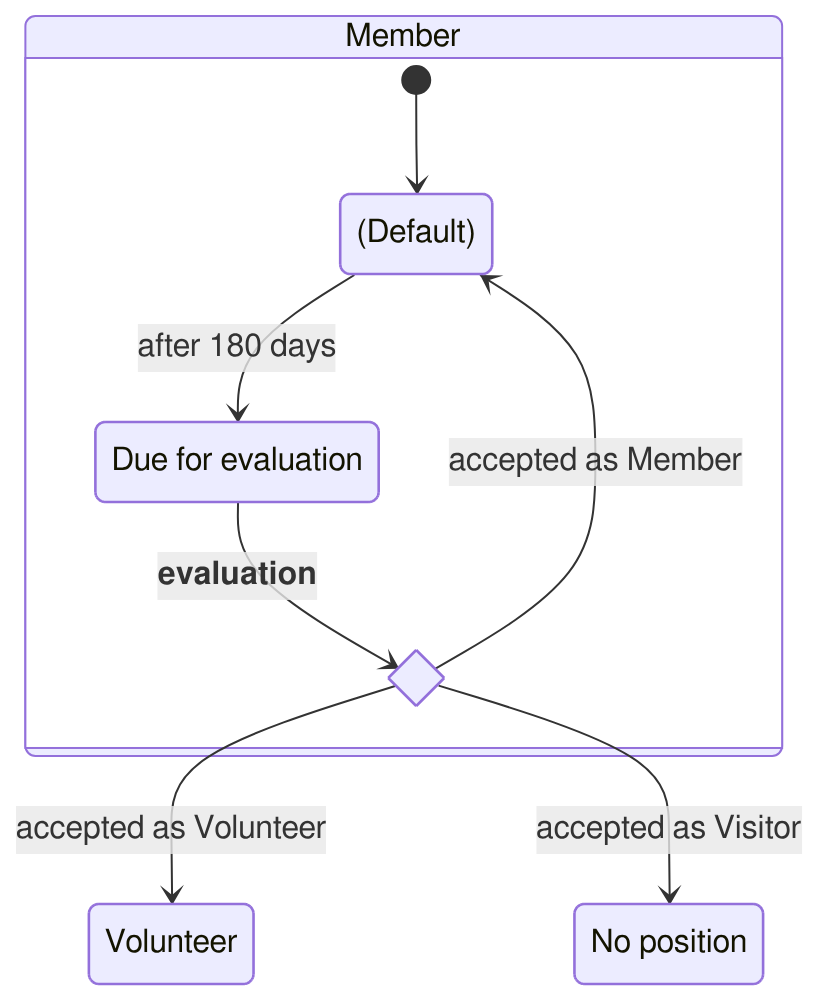
UML state diagrams are mostly identical to the statecharts defined by Harel.10 One difference worth highlighting is the use of a diamond for "choice" pseudostates. As the name implies, choice pseudostates are not states (the state-machine cannot "rest" at them) but are rather a conceptual and visual aid to show that several transitions are linked as the result of some choice. Harel had originally proposed a "C-in-a-circle" symbol for what he called "conditional" pseudostates. The diamond adopted by UML leans into the popularity of flowcharts, where the diamond is used to indicate a decision.
2.5 Statecharts summary
State machines are a model from computer science used to describe the states a system can be in and the transitions between those states. Early state diagrams only had elements for "flat" states, meaning that diagrams for more complex systems rapidly became unreadable due to state explosion. David Harel published an influential paper in 1987 presenting statecharts: a set of extensions bringing hierarchy, concurrency and other elements to state diagrams. UML developed state diagrams heavily inspired by statecharts, which became an international standard.
3 Position statecharts
The rest of this article rests on the following 3 claims:
- that positions (as defined by IAD Position Rules) can be modelled as states in a state machine, and;
- that entry into or exit from positions (as defined by IAD Boundary Rules) can be modelled as transitions in a state machine, and therefore;
- that position systems can be modelled as state machines and graphically depicted as statecharts
3.1 Seeing like a state machine
Describing a position system with the constraints imposed by state machines can be challenging. The first challenge is finding an appropriate way of looking at things, because it is not so clear how a person entering a position is like a light being switched on.11
One way of looking that might help is by thinking of a board game, say Monopoly. Each player's figure starting position is "Go" (initial state.) With every turn, a player rolls the dice and moves their figure (transition) to the relevant position (next state).
Another way, arguably more useful, is to think of entering and moving around a house. You start outside (initial state) and when you use the right door code and enter the house (transition), you are immediately and simultaneously inside the house, on the ground floor and in the entrance (next state(s)).
3.2 Defining requirements
I set out to make a position statechart for Kanthaus with the aim of describing the position system as clearly and comprehensively as possible. But when I got started, this turned out not to be so easy.
Firstly, there are many different free (and open-source) tools for generating statecharts, each offering enticing features. If you are like me, your wide eyes may slowly lead to aim-creep unless you are very clear about what is required and what is simply nice-to-have. After spending too many hours going round in circles, I realised that none of the newly discovered features were requirements.
Secondly, I rediscovered that clarity and completeness may be conflicting. Even though statecharts manage to present information far more clearly than the initial state diagrams, things still get confusing when arrows start to cross and are there are too many boxes. I ended up deciding not to show some of the less important transitions on the statechart, but rather explain them in a note beside.
My final requirements were to make a statechart:
- that describes the entire position system
- that explicitly depicts all positions and all major transitions
- that would fit as nicely as possible onto A4 paper
- that is as clear as possible, beautiful as a bonus
3.3 Tools for prototyping
Here I will recommend two tools for prototyping before getting started. More tools are discussed later on.
The first is pen and paper. While you have to do all the work yourself - no copy or paste - there are also no limitations to your creative urges. The directness of drawing by hand engages a completely different part of my mind than anything intermediated by a keyboard. Through my process, I scrawled over at least 6 sides of A4 and 1 envelope.
The second is Mermaid: a notation language for state diagrams as well as a javascript library for rendering them, conveniently available as a webapp — all free and open-source. All of the diagrams in this article with curved arrows were made with it. The notation is relatively straightforward and described in detail in their guide, but to give one small example, here is the notation that was used to generate the first mermaid diagram of the light switch:
stateDiagram-v2
    [*]
    state "Off 🌚" as Off
    state "On 🌝" as On

    [*] --> Off
    Off --> On : switch on
    On --> Off : switch off
Mermaid engaged a completely different part of my mind than drawing: not only by being constrained by the notation, but also that the generated diagrams had unexpectedly different layouts. The latter was initially quite frustrating, but when I accepted I was only prototyping, I found being forced to engage with different perspectives quite helpful.
For me, the use of both pen & paper and mermaid was quite illuminating, and I recall several points of confusion I was only able to disentangle through using both.
3.4 Basic position statechart
One can zoom in or out of a system to describe it at any level of detail. Here I will go through the creation of a "basic" statechart, one that goes into only enough detail to describe the whole system broadly.
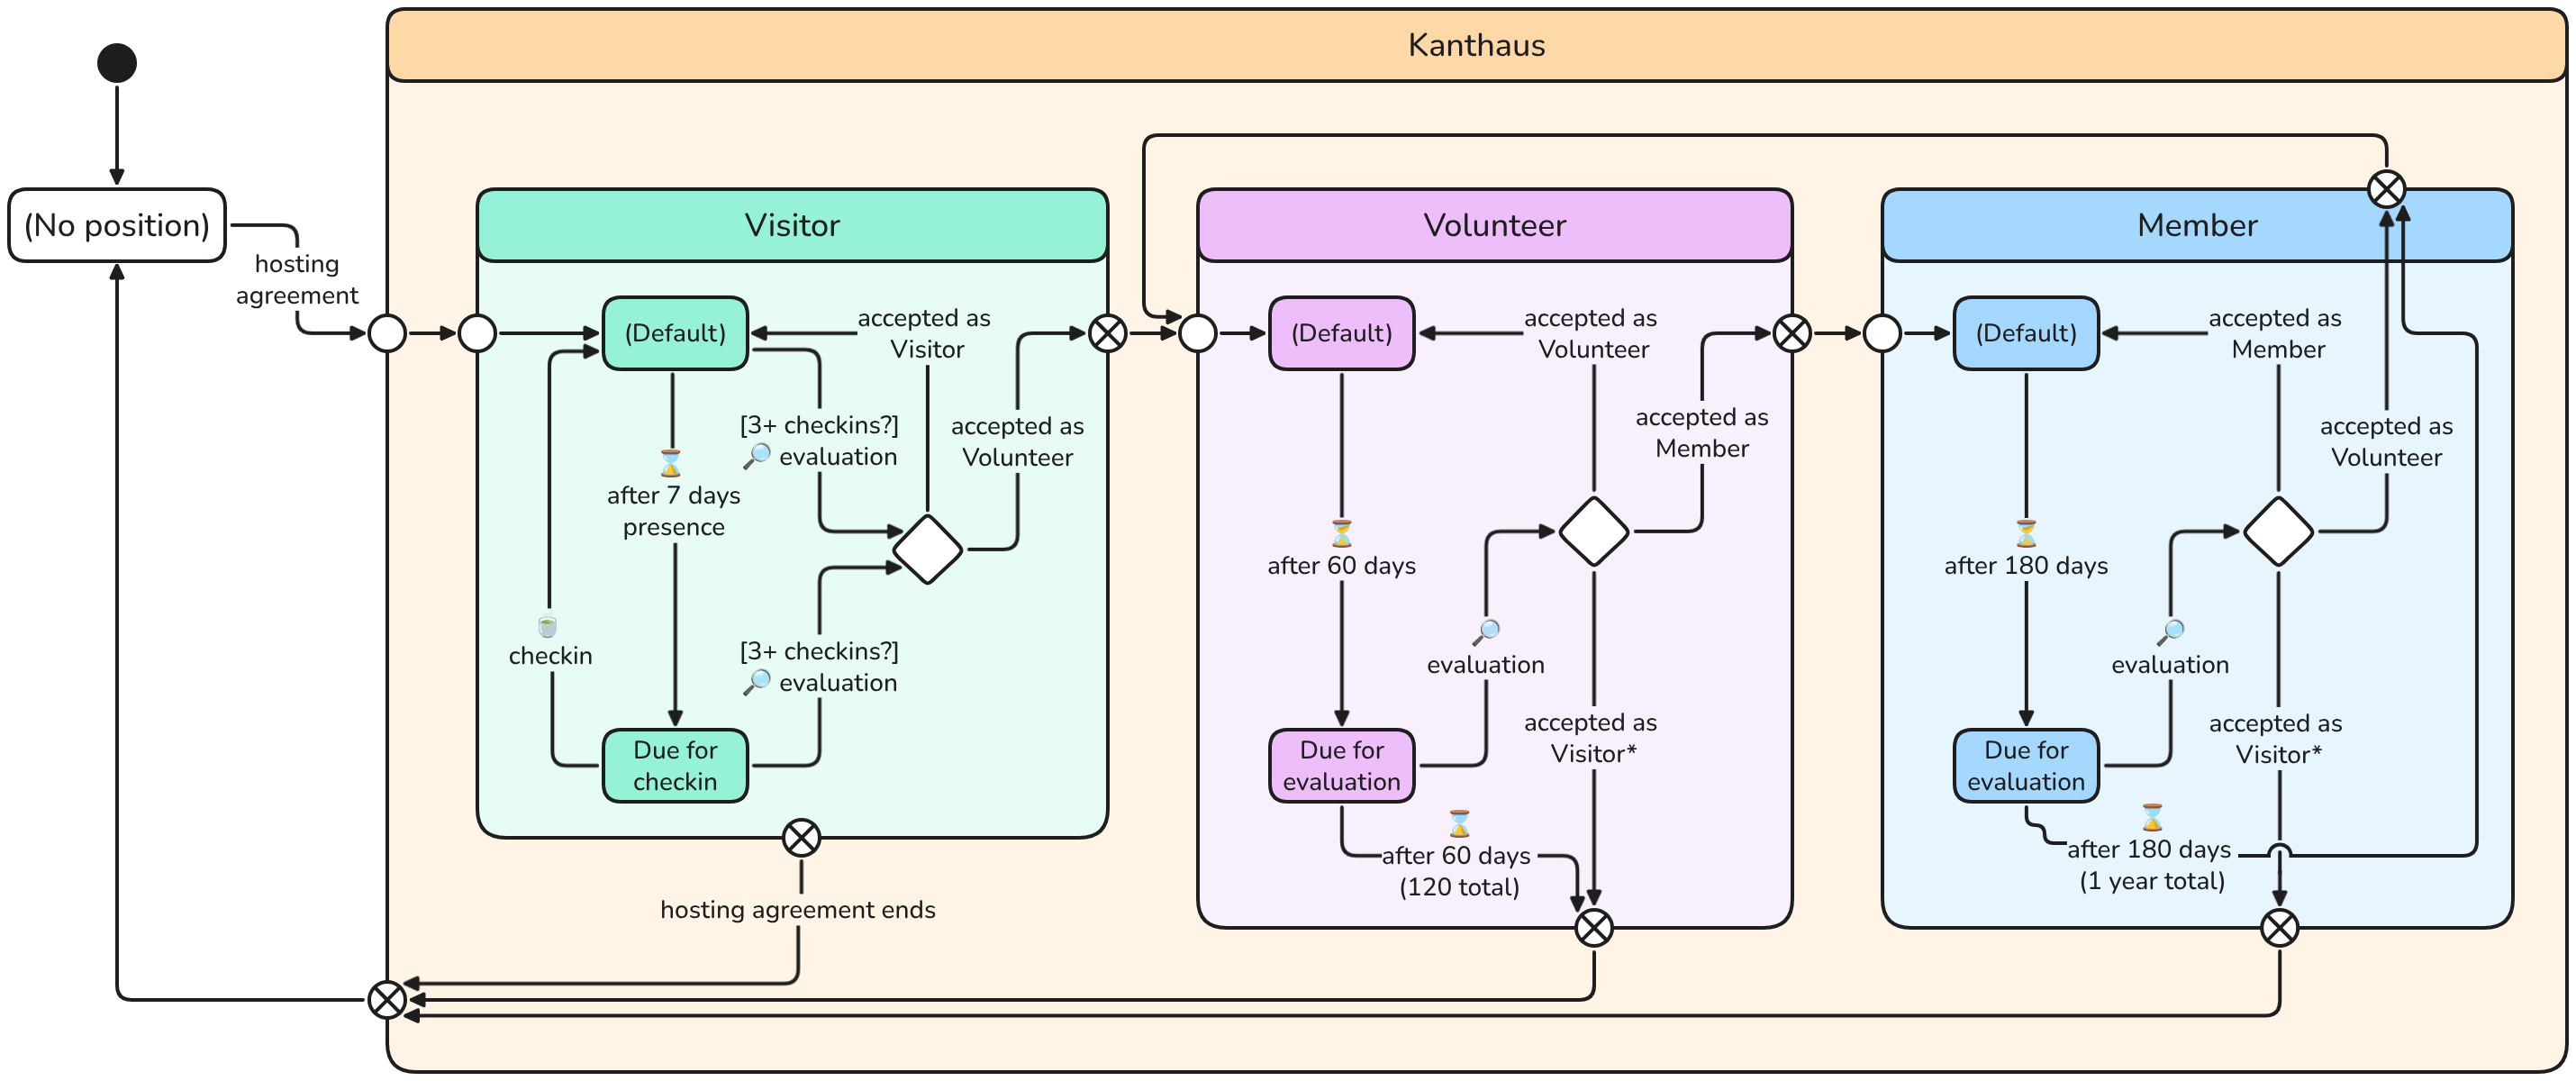
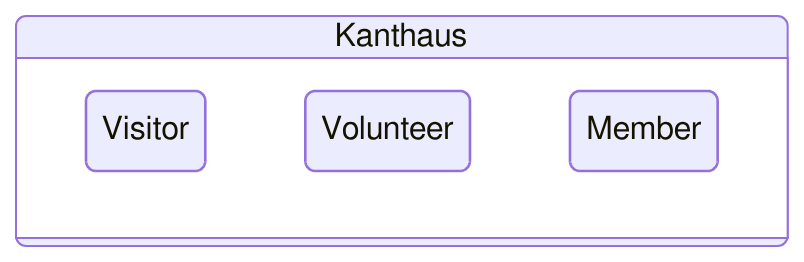
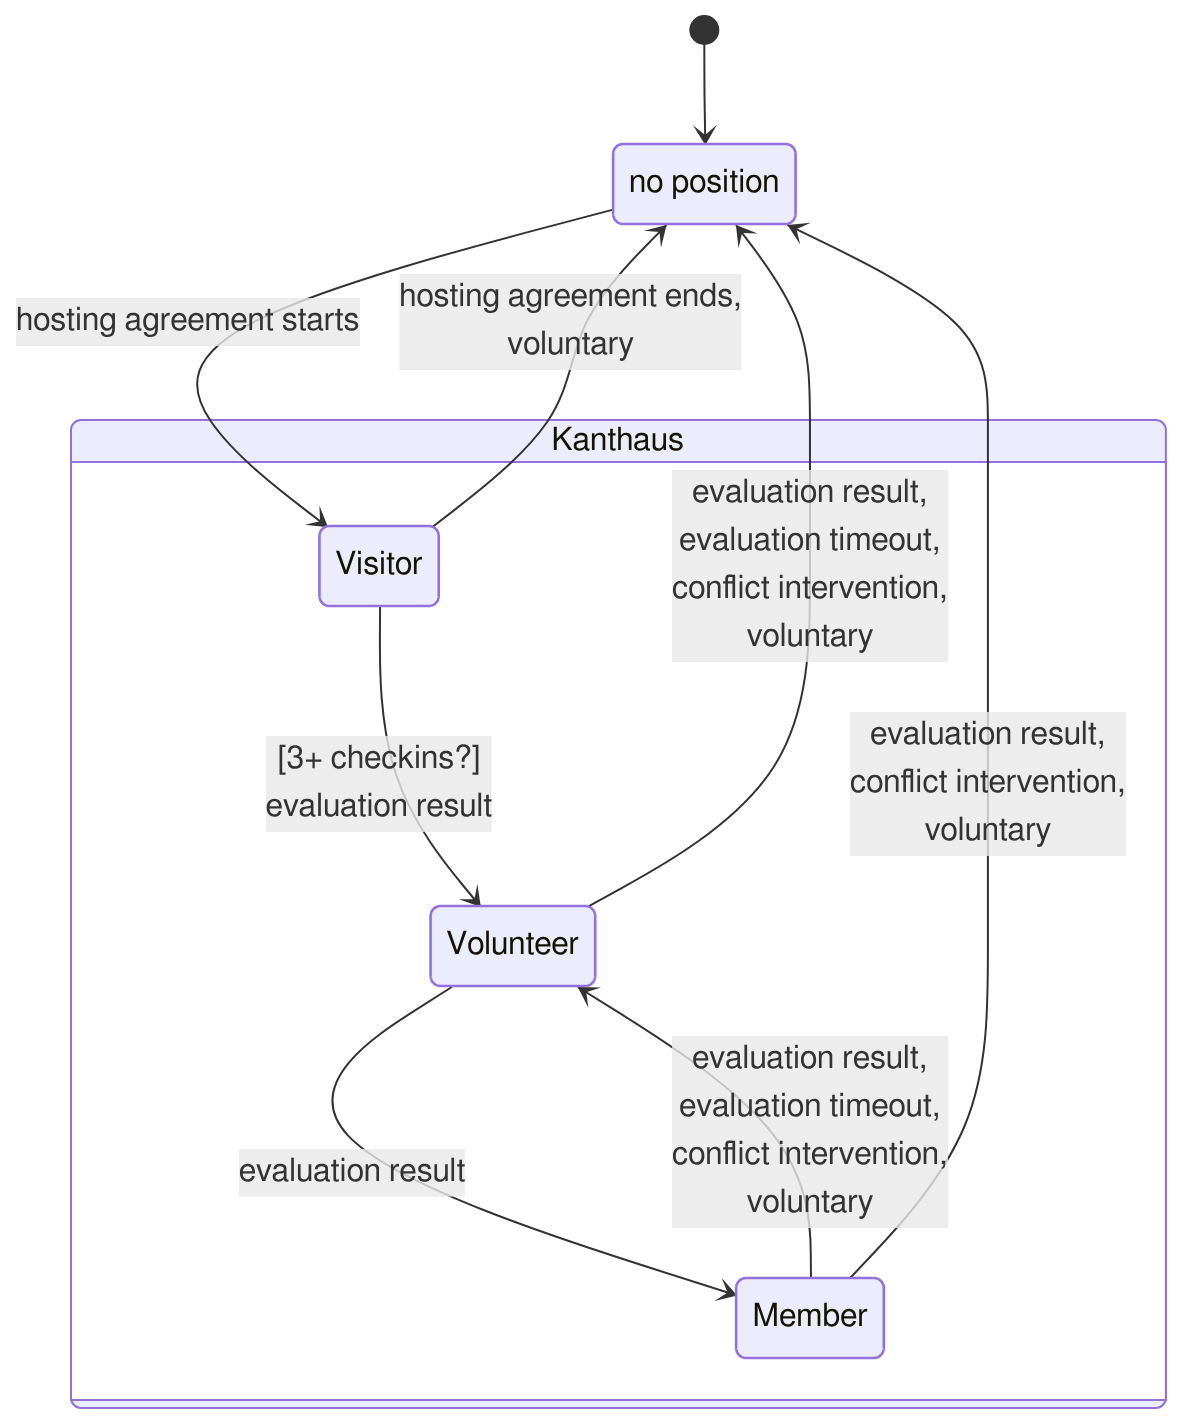
Identifying all relevant states is arguably the core of the exercise. Perhaps your organisation has only one position (e.g. "part of the group") in which case you will have a relatively simple statechart. The Kanthaus constitution explicitly specifies 3 positions: Visitor, Volunteer and Member. Each of these positions is a distinct state.

Anyone who holds one of these positions is also "in" Kanthaus, which although not explicitly mentioned in the constitution is at least a nominal group. The positions may be associated through an organisation superstate.
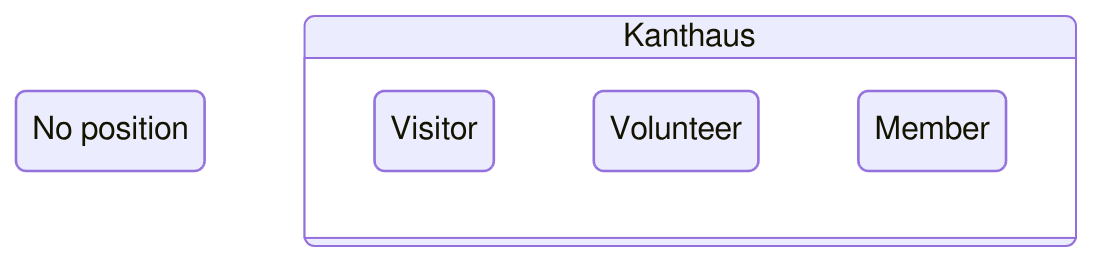
But how does someone get in? The transition from "outsider" to "insider" is perhaps the most important one, and requires the explicit recognition of a "non-position" state:
At this point, all states are accounted for. The next step is to add all state transitions, including the initial pseudostate and its transition. It helped me to really focus on one position at a time, and exhaustively note all outgoing transitions from that position.
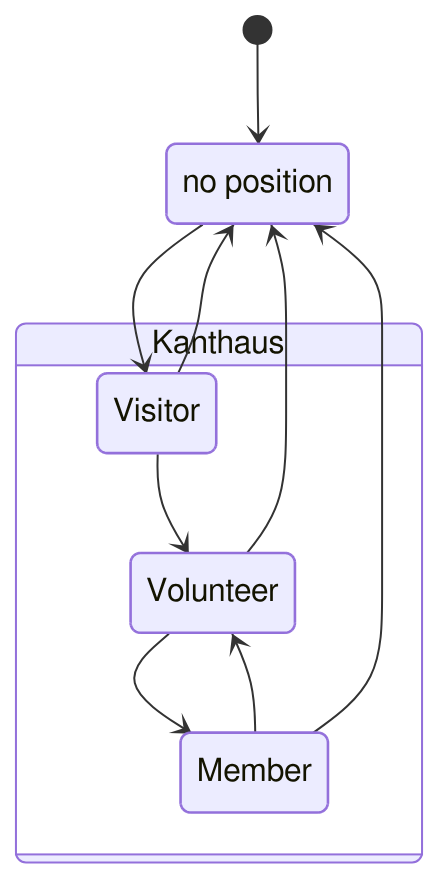
A basic position position statechart is achieved by then labelling the transitions:
3.5 Advanced position statechart
The statechart above, while comprehensive, obscures many details. To create a statechart that accounts for these details, it is necessary to descend into the position states and identify substates and transitions within them. As I said in the requirements section, I will only show major transitions, which in the case of Kanthaus means leaving out voluntary downward/outwards transitions and those resulting from conflict resolution interventions (the latter only happening a couple of times over almost 10 years).
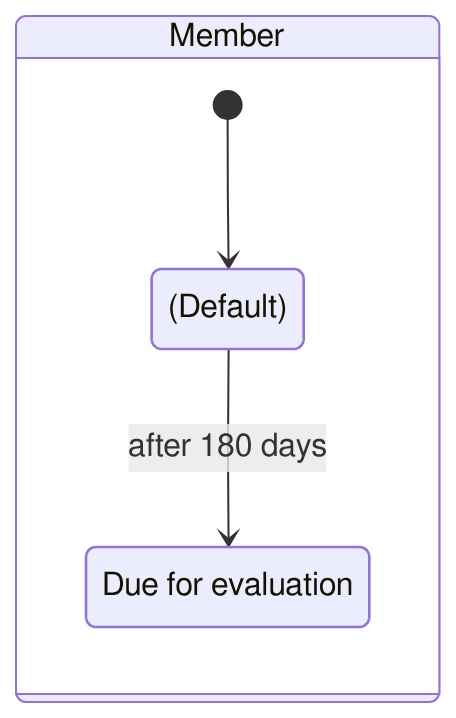
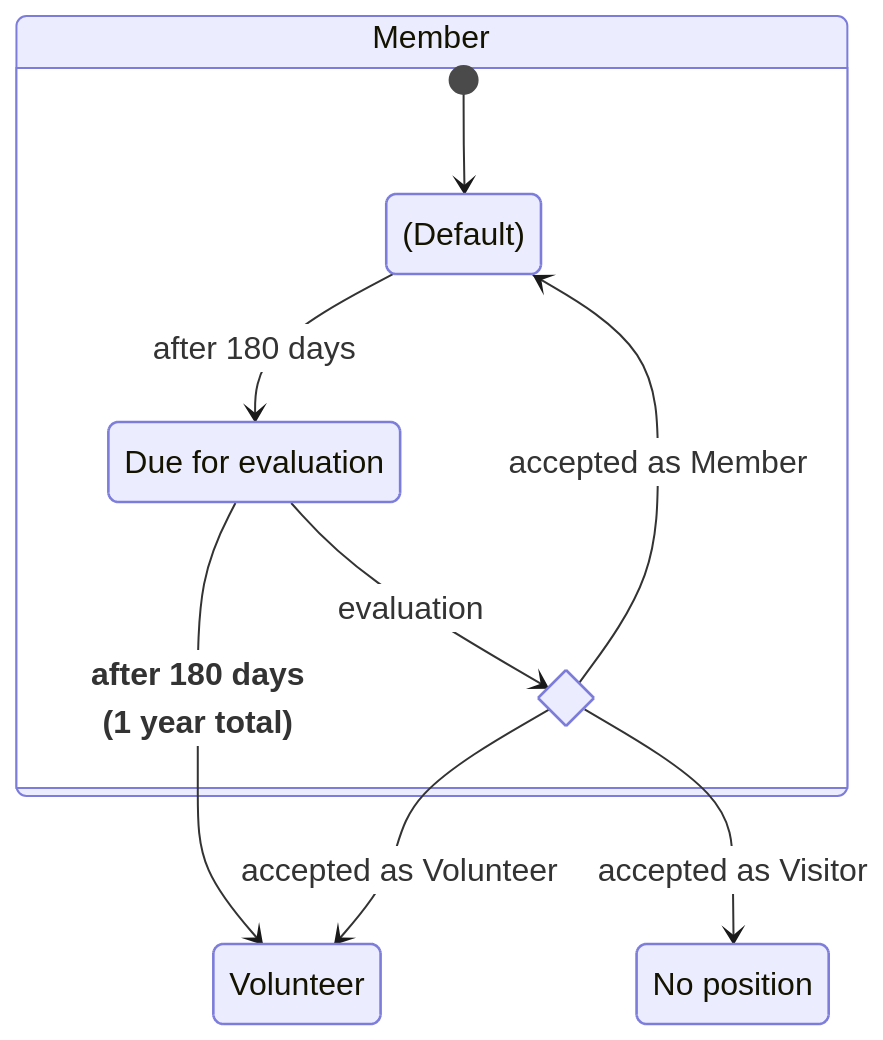
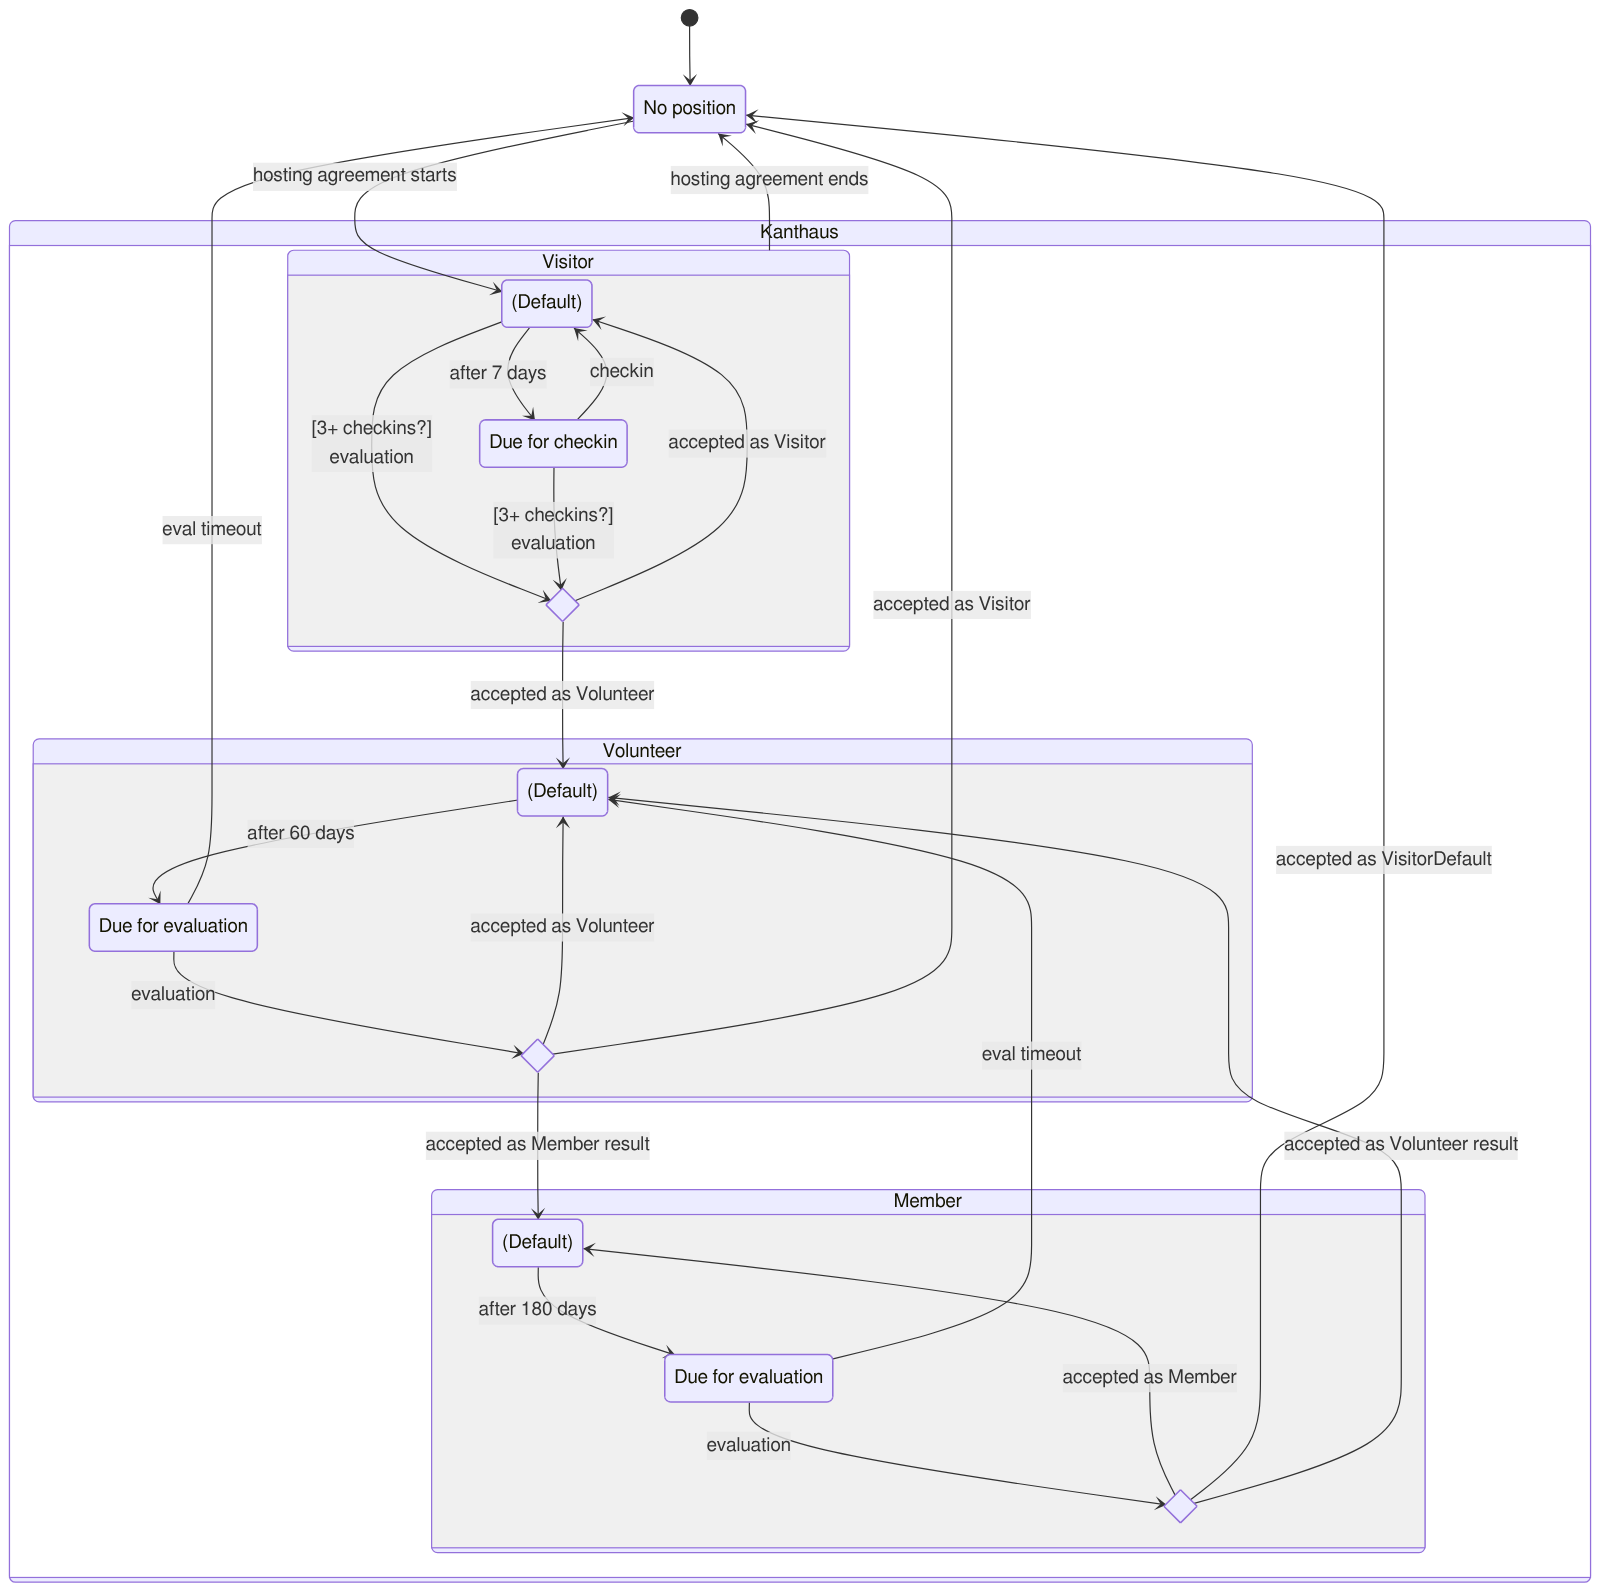
The position of Member is in fact the least complex, so we'll start there. A central procedure in the Kanthaus position system is the evaluation, a periodic appraisal through which community members determine the appropriate position for the person in question to continue with. A Member becomes due for evaluation 180 days after becoming a member, which can be modelled with the substate "due for evaluation". Before this, the Member can be considered to be in the a "default" substate. Substates can be thus used to model position attributes.
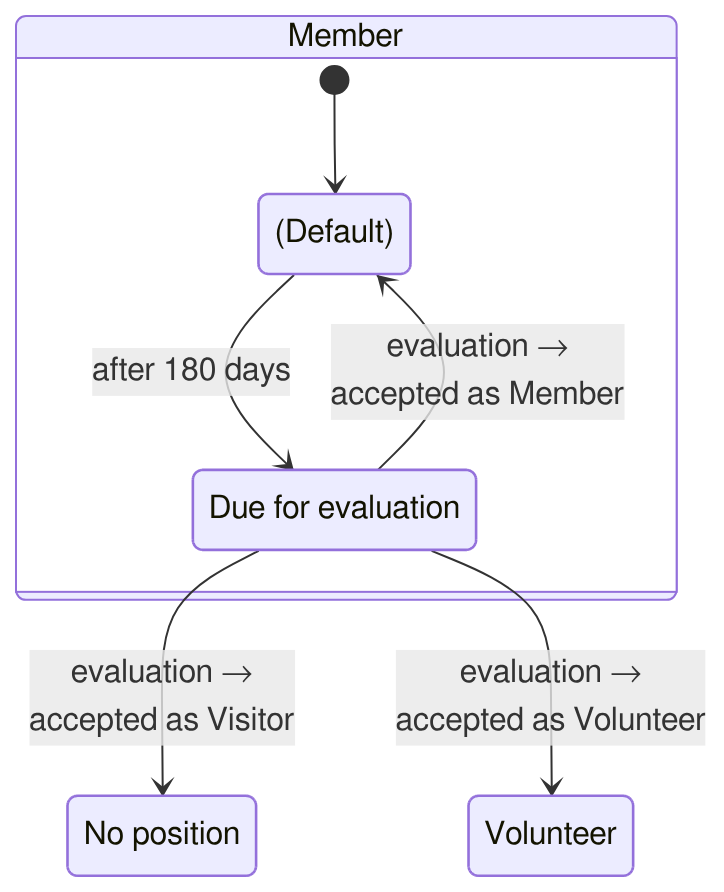
At their evaluation, a Member can apply to remain a Member or become a Volunteer or Visitor. The evaluation procedure itself determines the result through a vote of the other current members. If accepted as a Member, they reenter the "default" substate and the countdown starts again. If accepted as a Volunteer, they leave the Member position altogether and become a Volunteer. If accepted as a Visitor, they enter the "no Kanthaus position" state: this is because the Visitor position is determined exclusively by being hosted. (If before the end of the evaluation someone is willing to host, the person would instantaneously transition through "no Kanthaus position" to the Visitor position.)
The evaluation and its outcomes have a clearer visual association by using the choice pseudostate:
Additionally, if a Member does not have an evaluation within 365 days since (re)entering the position they timeout, becoming a Volunteer. This completes a detailed view of the Member position.
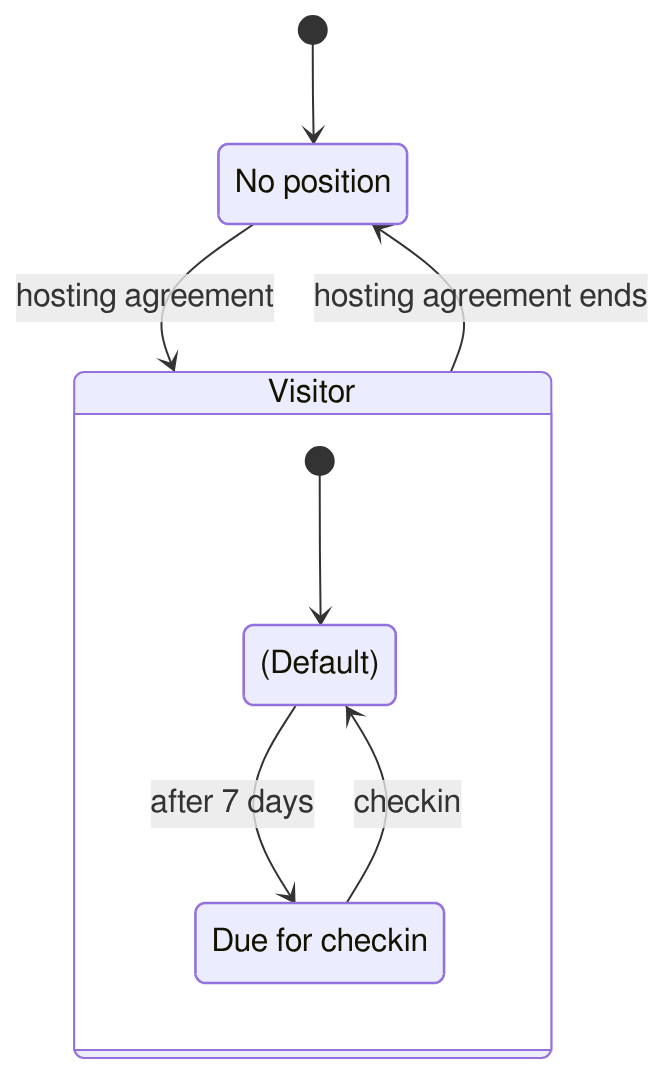
The Volunteer position operates quite similarly to Member, with different evaluation time periods. The Visitor position is however quite different. It is entered not via evaluation, but via hosting - this is when a Volunteer or Member agrees to take over technical and social responsibility for onboarding the person into the community. Should this agreement end for whatever reason, the position is lost. To keep up communication between the Visitor, Host and other community members, a checkin is due after every seven days. The checkin has no hard timeout, unlike evaluations, and therefore no formal impact on position.
After having completed 3 checkins, the Visitor is eligible for evaluation and may choose to have one at any point going forwards. At their evaluation they may apply to continue as a Visitor or become a Volunteer.
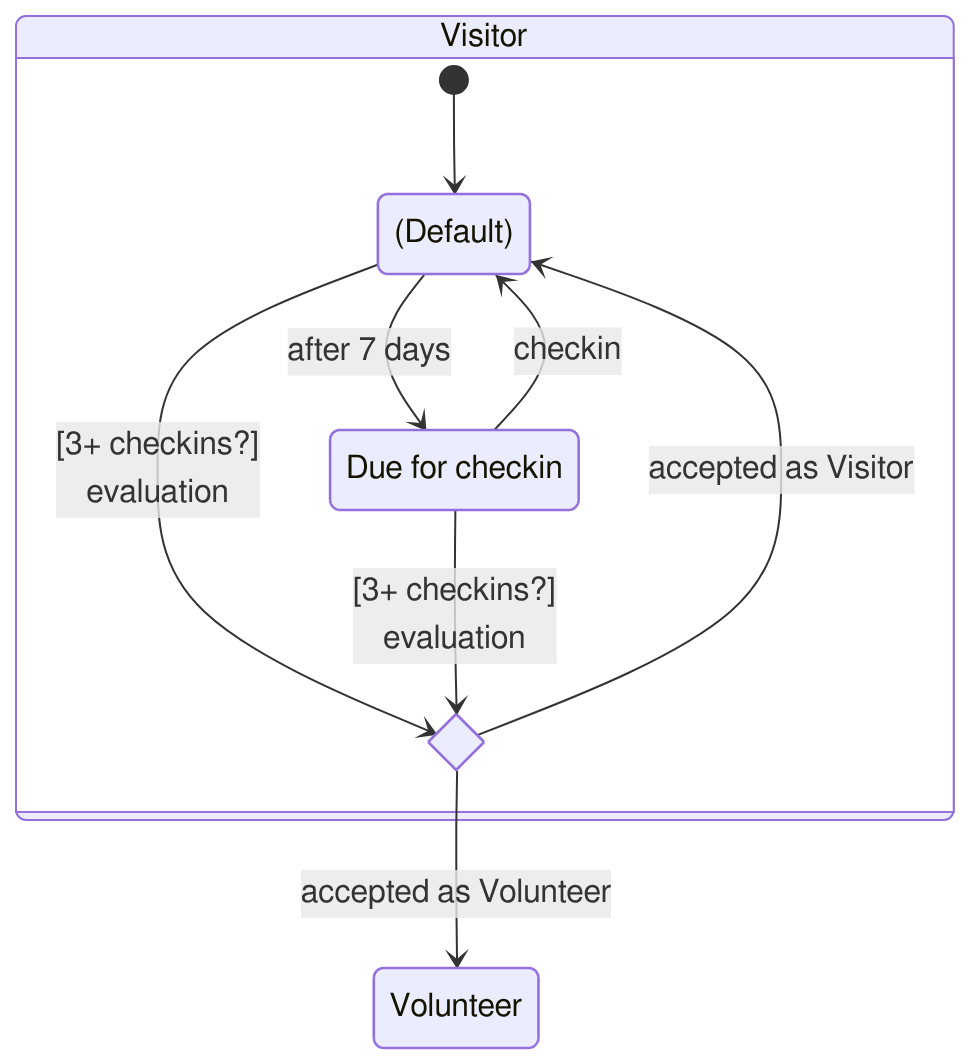
It would be an option to use the concurrency element within the Visitor state to deal with checkins and evaluation separately. (This is noticeable since 2 transitions have the identical event "[3+ checkins?] evaluation" and end on the same state.)
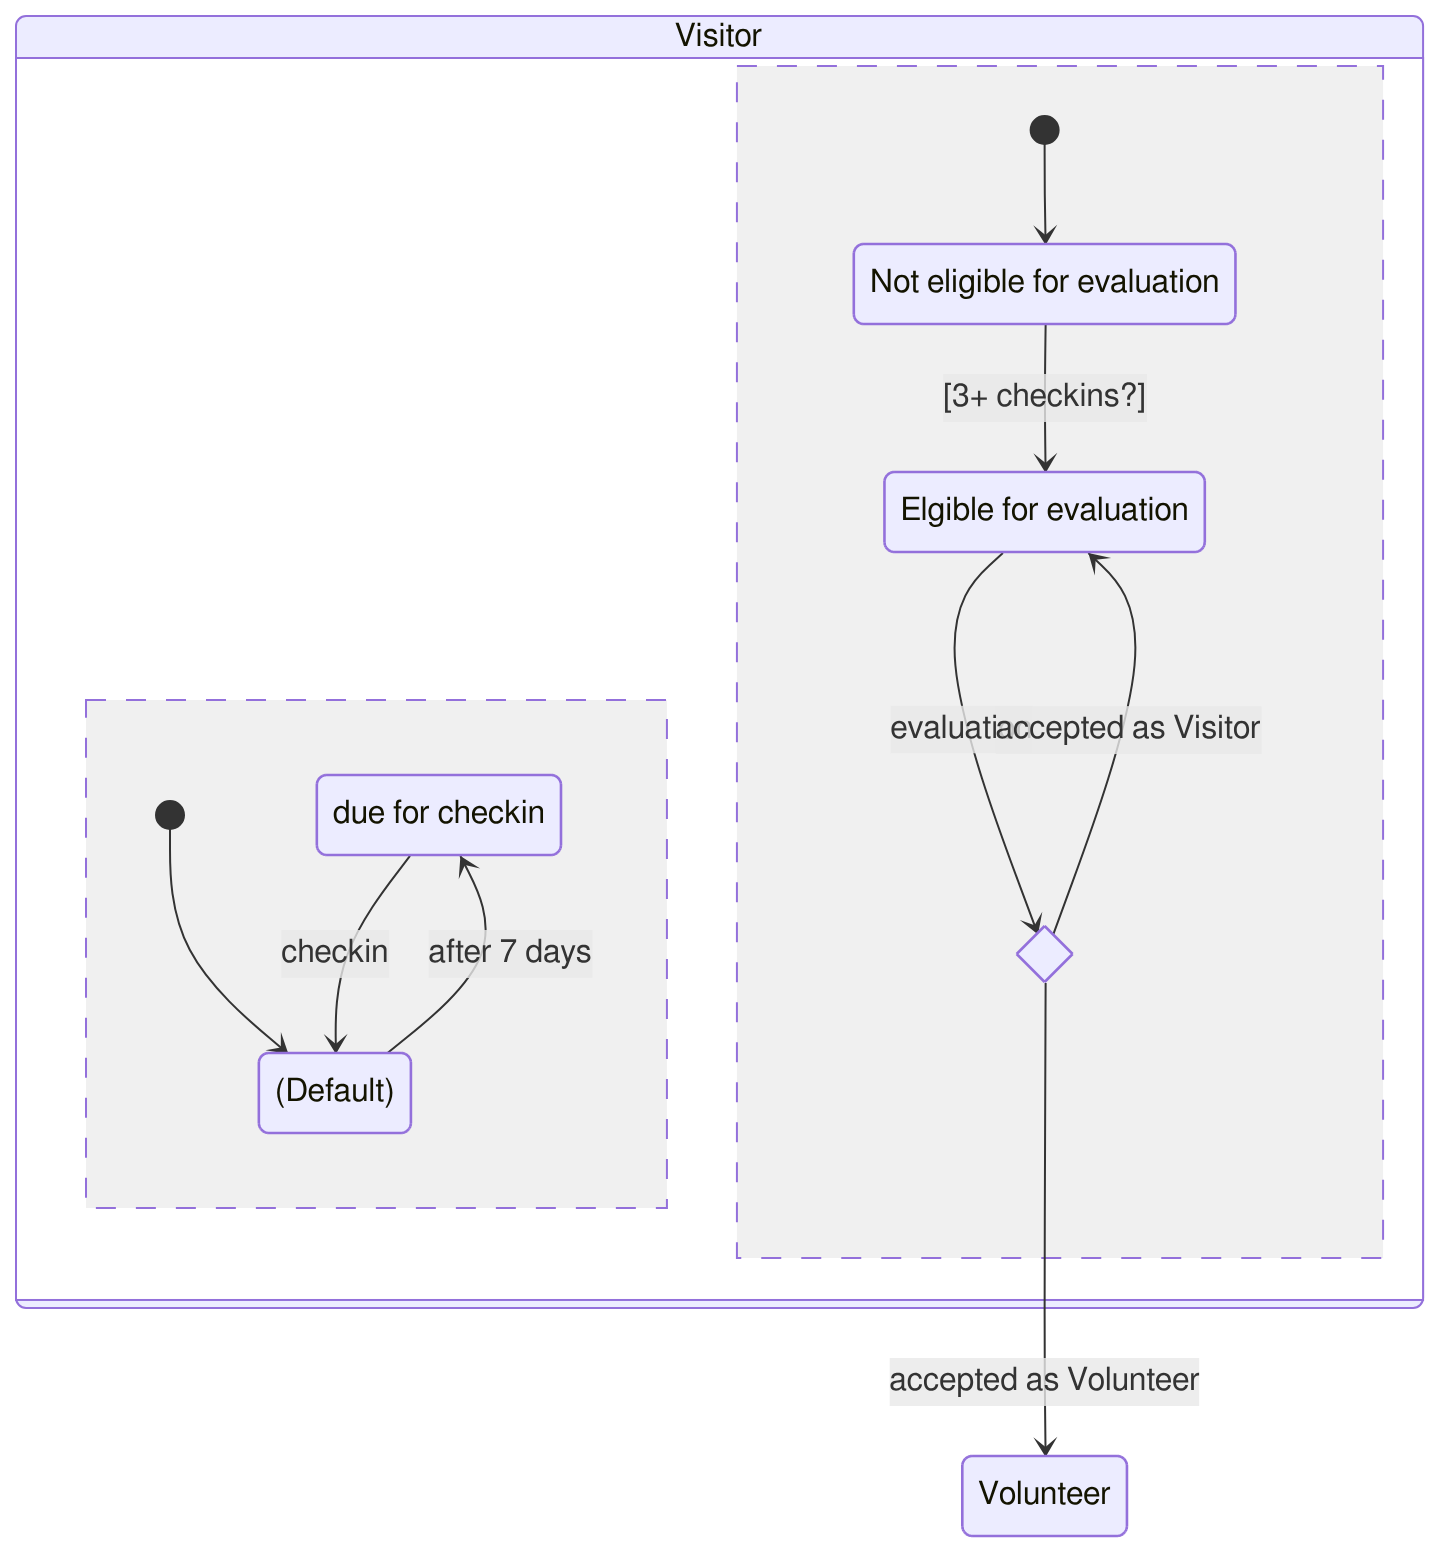
Ultimately I decided against the concurrent representation.12 My impression is that hierarchy and its nested box representation are far more intuitive than concurrency and its representation. Using concurrency would have made the statechart more complex altogether, which goes against requirements.
Applying this more detailed view of the Volunteer position and bringing the system together results in an much more advanced statechart:
3.6 Tools for finalising
The statechart above leaves a lot to be desired. I count at least two unnecessary arrow overlaps, and it is generally quite ugly. Here I will briefly cover some options for finalising a statechart, including the one I used to create the statechart at the beginning of the article. What constitutes 'final' is contingent on your requirements and preferences. (Perhaps the result of your prototyping is already satisfactory.)
In general, there are two approaches: generating (like with mermaid) or drawing (by hand or digitally.)
There are many statechart generators13 all requiring the statechart to be described with some particular notation. This article has looked at mermaid which has fairly simple notation that is shared with some other tools (notably PlantUML, upon which it is based). There is also a W3C standard for statechart notation, SCXML, but few tools support it and it is not easy to write. Most tools use their own Domain Specific Language (DSL), a unique notation intended for that tool only.
Once the generator has parsed the notation, it will use some layout algorithm to decide where to place state boxes and direct transition arrows. Mermaid uses the popular Dagre algorithm by default, the results of which you see in most of the generated diagrams in this article. It's tried and tested and produces curved arrows which often unnecessarily overlap. Another increasingly popular layout algorithm is ELK, which gives angled arrows that avoid overlapping at all costs and creates a generally different box layout. Some tools allow the selection of different layout algorithms (e.g. mermaid also supports ELK.)
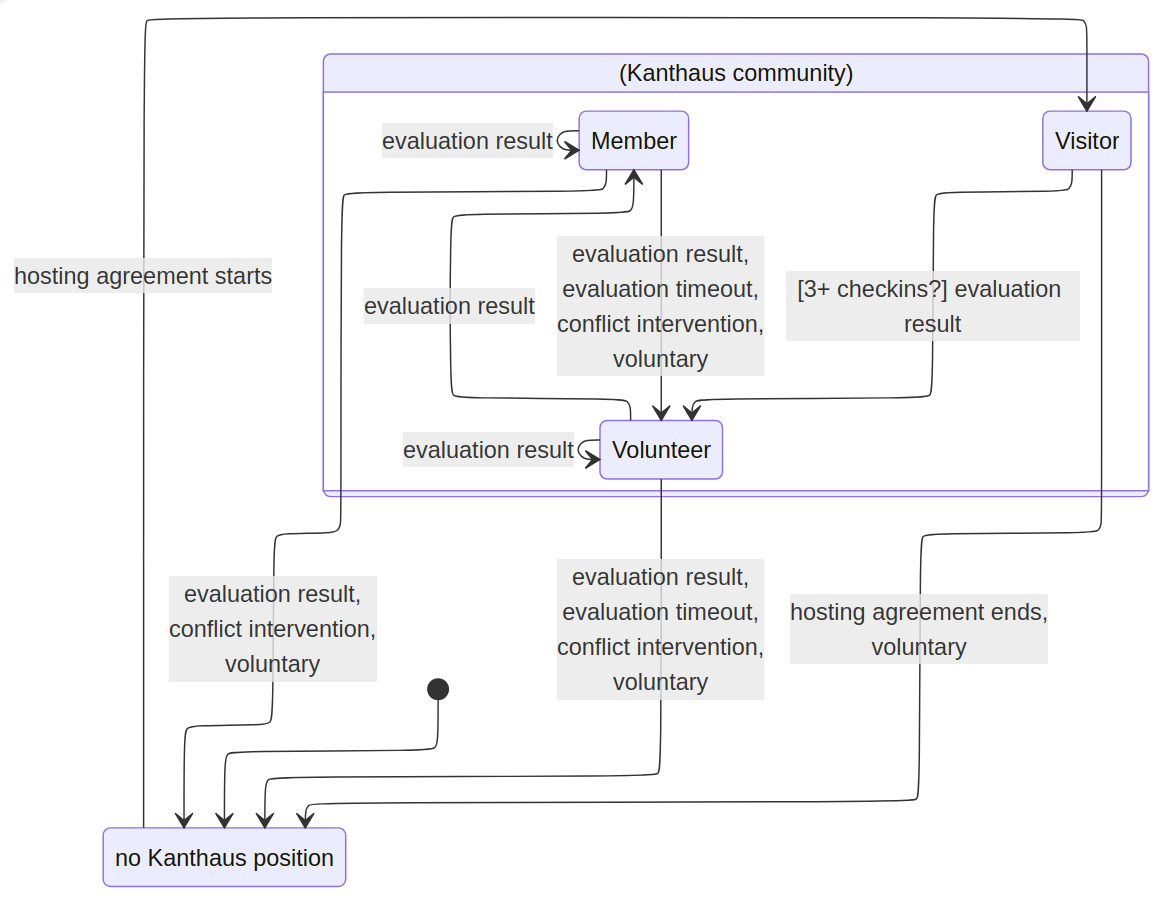
I spent a lot of time trying out different generators, tweaking options and switching layout algorithms to try and get the result I was looking for, which often came close but remained frustratingly out of reach. This lead me to understand that layout is a fundamentally hard problem. What if it is important that two particular boxes are on the same level? Or that certain arrows go in certain directions? There are some ways to pass this information to some generators, but when I realised this would pretty much mean coding a diagram, I realised I would rather draw one.
In comparison, my search for an appropriate drawing tool was much simpler, despite there being many more options. I didn't really consider hand-drawing, on account of editing and reproduction costs being so high. I then looked at the venerable Inkscape, my go-to for all things visual, but I found the connector tool a little clunky and realised that Inkscape was generally overkill. Then I turned to Excalidraw, a very nicely designed whiteboard webapp I've used to make other diagrams in the past. Excalidraw has almost perfect feature constraint for creating statecharts very quickly. I created the statechart at the beginning of the article using Excalidraw, and it took a fraction of the time I'd spent on generators.
Conclusion
Position statecharts make position systems more accessible and can contribute to more coherent, fair and sustainable governance. The constaint of describing a system as a state machine brings a simplicity and therefore clarity. Yet there may be situations where breaking that constraint is worth it. In situations where holding multiple formal positions simultaneously is the default, a different paradigm may be more fitting (such as "circles" diagrams in Sociocracy.)
Thanks for reading, get in touch if you have questions or ideas. Happy charting!
Disclaimers
I received no money or other renumeration for writing this. I am not a member of any of the groups making the software I mentioned although I have had some friendly interactions. The only things generated in this article were the mermaid diagram: old-school, deterministic generation. Oh, and structure is necessary but not sufficient for good governance.
References
- Freeman, J. (1972). The Tyranny of Structurelessness. Berkeley Journal of Sociology, 17, 151–164. http://www.jstor.org/stable/41035187
- Hardin, G. (1968). The Tragedy of the Commons: The population problem has no technical solution; it requires a fundamental extension in morality. Science, 162(3859), 1243–1248. https://doi.org/10.1126/science.162.3859.1243
- Harel, D. (1987). Statecharts: A visual formalism for complex systems. Science of Computer Programming, 8(3), 231–274. https://doi.org/10.1016/0167-6423(87)90035-9
- Object Management Group. (2017). Unified Modeling Language, Version 2.5.1. https://www.omg.org/spec/UML/
- Ostrom, E. (1990). Governing the commons: The evolution of institutions for collective action. Cambridge University Press. https://doi.org/10.1017/CBO9780511807763
- Ostrom, E. (2005). Understanding institutional diversity. Princeton Univ. Press. https://doi.org/10.2307/j.ctt7s7wm
- Polletta, F. (2002). Freedom is an endless meeting: Democracy in American social movements. University of Chicago Press. https://doi.org/10.7208/chicago/9780226924281.001.0001
- Scott, J. C. (1998). Seeing Like a State: How Certain Schemes to Improve the Human Condition Have Failed. Yale University Press. https://doi.org/10.2307/j.ctvxkn7ds
- Shannon, C. E. (1948). A Mathematical Theory of Communication. Bell System Technical Journal, 27(3), 379–423. https://doi.org/10.1002/j.1538-7305.1948.tb01338.x
Footnotes
-
Funnily enough, when I wrote David to ask if I could publish his diagram, he claimed he was inspired by something I had said earlier... an inspiration Ouroboros. ↩
-
This trend can be partly attributed to the massive impact of Garrett Hardin's The Tragedy of the Commons (1968). Ostrom met with and debated Hardin, and her Governing the Commons is in part a refutation of his paper. ↩
-
The fortune Alfred Nobel amassed through the invention, development and sales of explosives and armaments only established 5 prizes. In 1968 the Bank of Sweden donated a large sum of money to establish a separate prize for Economics in his memory. ↩
-
Understanding institutional diversity, pg. 3 ↩
-
Understanding institutional diversity, pg. 5 ↩
-
The Action Situation variable Actions covers the things that holders of a given position are legally allowed or required to do. This is something usually bundled into the concept of positions, but the IAD deliberately abstracts the identity of a position from its attributes. (A visualisation of Actions (as defined by their accompanying Choice Rules) can be adequately achieved with a table such as this example for Kanthaus positions: https://wiki.kanthaus.online/Position_attributes_table) ↩
-
"Exogenous" to the the Action Arena, that is. Still, a bit confusing. In my mind I rename them system variables. ↩
-
Understanding institutional diversity, pg. 193 ↩
-
UML is here to stay, but it's popularity has waned since the 2000's. Several of the people who worked deeply on it published articles reflecting why, mentioned in this Mermaid blog post: https://mermaid.ai/blog/posts/sequence-diagrams-the-good-thing-uml-brought-to-software-development. The overlapping point they make is that UML, in an attempt to be universal, got too complex. UML Version 2.2 was over 1000 pages long, with the bulk of volume covering niche cases that were mostly not encountered. And since few diagram tools managed to implement all aspects of the standard exactly, each one essentially developed a different flavour of the standard... See xkcd 927 ↩
-
The naming gets a bit confusing. So, state diagrams are used to refer to the initial diagram method which suffers from state (and transition) explosion. Harel coined the term statechart to recognise the significant differences which he'd made, which preserving "state" in the name. UML chose to use state diagram to refer to the extended state diagram, pretty much what Harel called statechart. It seems that the initial state diagram is not really used any more, so it's presumably not confusing for those in the industry. I chose to stick with statechart primary because I think it sounds cooler... and I like that it has a navigational feeling. ↩
-
The title of this section is a half-joke made after James C. Scott's Seeing like a state. He looks at how nation states' efforts to control their domain has typically lead them to try and standardise things, including their subjects, often with significant coercion. Considering a position system as a state machine could induce a desire to simplify things. ↩
-
This is thanks to Timber. I was excited to use all the statechart elements; they wisely recommended me not to. ↩
-
See the comprehensive lists on https://modeling-languages.com/ as well as the 'awesome finite state machines' list on GitHub https://github.com/leonardomso/awesome-fsm ↩